如何用捕获-再捕获估算 AI 智能体召回率
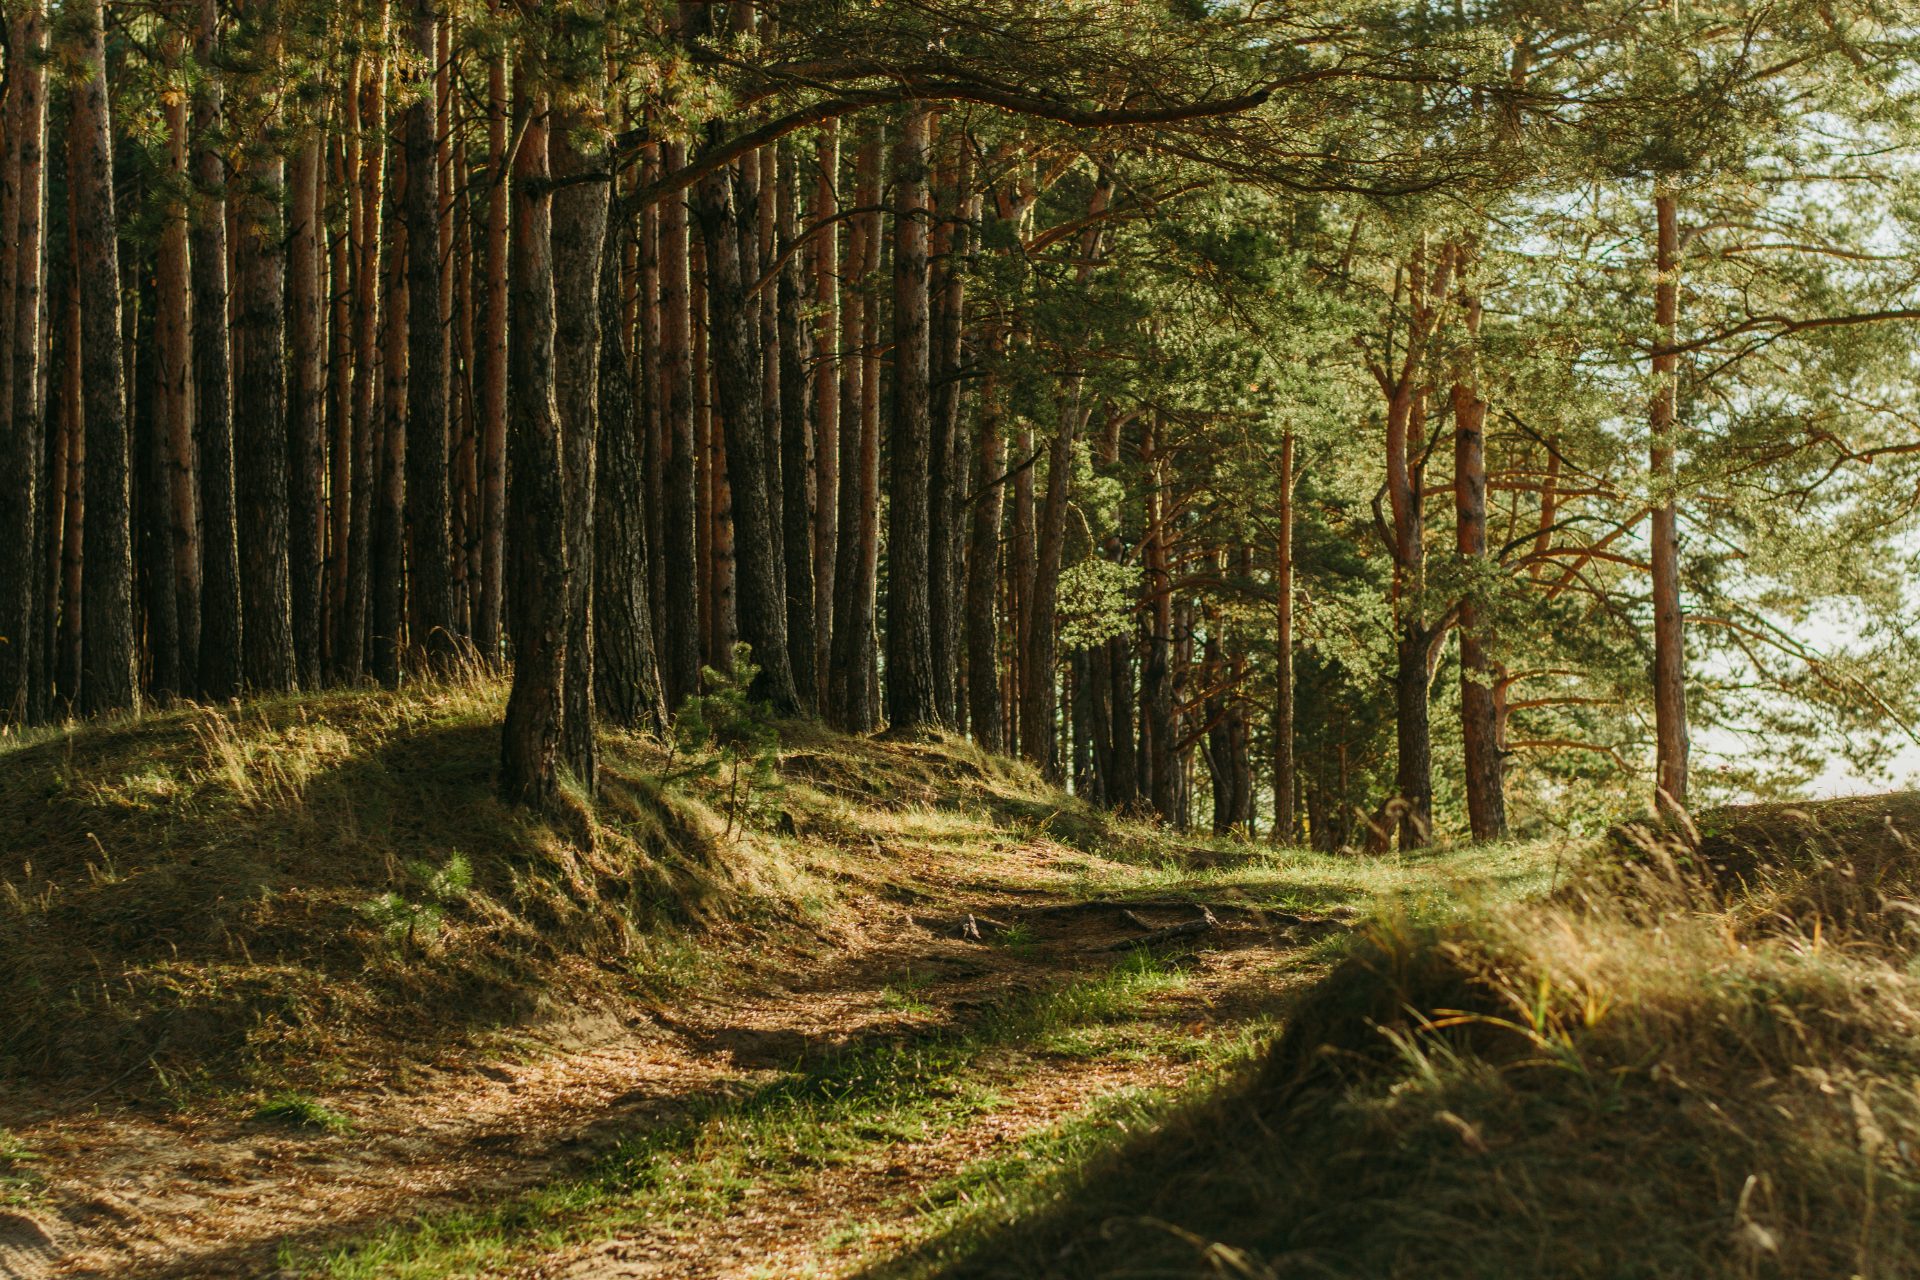
我非常喜欢针叶树。我喜欢在森林里散步,看针叶和球果。
你可能会纳闷,为什么在一篇关于 AI 智能体的文章里会读到这些?
事情是这样的:我搬到了另一个国家,想找一些能真正享受在松树间散步的地方,但我找不到便捷的方法,因为这种散步在那里不太流行。于是我开始把绘制针叶林地图当作一个副业项目,为像我这样的人做点东西。计划是拿官方森林资源清查数据,找出其中那些有名称的地点,然后放到地图上。我以为命名这部分只需要一个晚上,但实际上花了我好几天,还有大量、海量的 Token,才弄清楚如何找到并合并我想要的数据。
名称来自两个来源:由志愿者绘制的 OpenStreetMap,以及国家测绘机构 Ordnance Survey。我当时的假设是,这两者合起来会列出该国几乎所有有名称的针叶林,所以我就把它们合并了,然后继续往下做。
两者合起来找到了 1,515 片面积在 100 公顷或以上的森林。OpenStreetMap 有其中 1,052 片,Ordnance Survey 有 1,190 片,727 片同时出现在两张地图上。出于好奇,我把这三个数字代入了一种自 1890 年代以来渔业科学家一直在使用的计算方法,结果它显示应该大约有 1,722 片森林,这意味着两张地图合起来漏掉了大约 207 片,约占 12%。
我很惊讶,也有点怀疑,因为没有人见过那 207 片森林。一个计算怎么知道它们存在?
这个方法从何而来
想象你想知道一个湖里有多少鱼,但你不能把湖水排干🎣。你捕到100条鱼,给每条鱼做一个小标记,然后放回湖里;一周后你又捕到100条。如果第二次捕到的鱼中有20条带有标记,那么你第一次捕到的鱼大约占整个湖鱼群的正分之一,所以湖里大约有500条鱼。
这被称为捕获-再捕获。丹麦生物学家 C. G. J. Petersen 在 1890 年代将其用于幼鲽,Frederick Lincoln 在 1930 年将其用于北美鸭子,1951 年 Douglas Chapman 加入了一个小校正,使其在重叠较小时表现更好。
两张地图的作用就像两次捕获。每张地图是一张网,同时出现在两张地图上的森林就是被再次捕获的鱼,重叠部分的大小说明了每张地图的完整程度,从而说明它们都未捕获到多少森林。
整个估计器只需五行:
def chapman(n1, n2, m, z=1.96): """从两次独立捕获中估计总数。 n1, n2:各来源发现的条目数;m:两者都发现的条目数。 """ N = (n1 + 1) * (n2 + 1) / (m + 1) - 1 var = (n1 + 1) * (n2 + 1) * (n1 - m) * (n2 - m) / ((m + 1) ** 2 * (m + 2)) return N, N - z * var ** 0.5, N + z * var ** 0.5 N, lo, hi = chapman(n1=1052, n2=1190, m=727)
对于森林,这给出的估计值是 1,722,95% 区间为 1,678 到 1,765。
可能使其失效的假设
这一切背后有一个重要假设:两个来源必须相互独立。换句话说,一片森林出现在第一张地图上,不应使其更有可能或更不可能出现在第二张地图上。
有两种显而易见的方式会让这件事出错。
第一种是「知名森林问题」。有些森林出现在每一张地图上。如果某些森林对两个来源来说都更容易被找到,重叠部分就会过大,估计值随之被压低。在这种情况下,12% 只是一个下限;真实的差距可能更大。
另一种可能是两张地图各自擅长的东西不同。志愿者可能更倾向于去公园和自然保护区,而全国性调查则更可能纳入正在经营的种植林地块。如果每个来源都擅长发现某一类森林,重叠部分就会变小,估计值则会朝另一个方向偏离,变得过高。
我对此做了一次小规模核查。在我此前为另一项测试挑选的 18 片知名森林中,有 10 片同时出现在两张地图上。那是 56%,而所有森林整体是 48%。这略微指向知名森林更容易被找到,不过 18 片森林作为样本实在太小,难以据此有把握地下结论。
我实际上无法直接检验那个 12% 的估计值,因为并不存在一份完整的森林清单可供对照。真正让我记住的反而是这种失效模式本身。当两个来源共享同样的盲区时,这个方法就会失灵。
而这又让我想到一个更广泛的担忧。眼下许多团队正在交付 AI 智能体,并用 LLM 评判器来评估它们,而这个评判器往往与智能体本身来自同一模型家族。此外,最近的研究显示,来自同一提供方的模型往往犯同样的错误。因此在许多 AI 评估项目中,我们可能正在用共享同一盲区的来源去衡量模型,而它们之间的一致性会给我们带来虚假的信心。
AI 评估中的同一个盲区
前段时间,我在工作中参与构建了一个用于填写合同的 AI 智能体。这些文档大多是篇幅很长的合同(劳动合同和服务协议),每份至少 50 页,并且以多种语言写成。合同里反复出现需要填写相同信息的空白处:姓名、地址、出生日期、公司信息。我们的想法是,不应该让任何人把这些信息一遍遍手动输入到每一份新文档里。
我们已经存有双方的详细信息,并将其映射到各自在合同中的角色——通常第一方是公司,第二方是员工。这个智能体的任务是找出合同中的每一处空白,判断它要求的是哪一方、哪项信息,然后填写进去。如果合同上写的是“员工姓名”,智能体就应该填入员工的名字;如果写的是“出生日期”,就应该填入 01-01-1990。
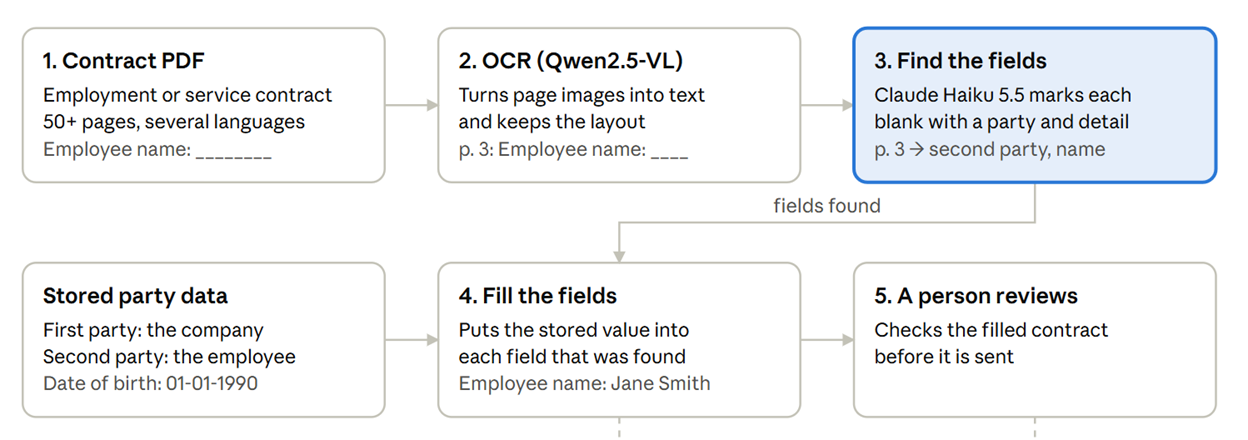
合同填写智能体的分步流程(图片由作者提供)
Qwen2.5-VL 将扫描页面转换为文本,Claude Haiku 5.5 定位各个字段,已存储的值被填入其中,最后在发送前由人工核对结果。
我为这个智能体搭建了评估体系。它起初是对这 100 份合同进行人工质检,由审核人员逐一手工检查已填写的字段,同时用第二个 LLM 充当评判者。这两项检查对智能体找到的每个字段都会问同一个问题:
但这些检查都没有衡量那些没有人找到的字段。
如果智能体在某个框里填错了值,会有人发现并纠正——很简单,对吧?但如果智能体压根没检测到某个字段,它就不会出现在任何报告里。
当我看到两张全国地图在727片森林上结果一致、却仍然漏掉12%时,我意识到我们的检查也有同样的盲点:评判者和复核者只看智能体已经找到的东西,因此这套设置永远看不到智能体漏掉的字段。要统计这些字段,你需要第二个能独立检索文档的来源,而且即便如此,也只有当这两个来源不会倾向于漏掉同样的东西时才有效。
在带有完整标准答案的合同上测试它
总体而言,AI 评测是可以核验的,只要所挑选的任务中有人已经把所有内容都标注好了。但对于一个新任务来说,构建这样一份完整标准答案的成本很高,而且即便是细致的人工标注也会漏掉东西。
下面这部分并不是你在工作中使用该方法的方式。
在生产环境中,没有人给你的文档打过标注,而这恰恰是你首先需要估计值的原因。在这里,标注扮演的是另一种角色。估计器从来看不到这些标注,它只会拿到一张表,显示哪个智能体找到了哪条引文,而我在事后用这些标注给它的答案打分。
所以把这个部分看作一个演算示例,而不是生产环境的配置。因为正确答案是已知的,它展示了该方法的表现如何、会在哪里出错,以及当你没有标准答案而实际使用它时,你能信任它到什么程度。
为了展示这在实践中意味着什么,我需要带有完整标准答案的文档,所以我用了 CUAD,它恰好具备这一点:510份商业合同,律师在其中标注了41种类型的每一条款。
我选取了约10,000 Token以下的294份合同,以及10种可能在一份合同中多次出现的条款类型,例如许可授予、责任上限、禁止转让和审计权。这样得到1413条已标注条款,这就是下面每个估计值所要对照的真实数字。
每个智能体只读一遍合同,并引用 10 种类型中的每一条条款,然后我将这些引用与律师的标签进行匹配。当引文与条款的重叠部分至少达到较短文本的一半时,该引用就算作找到了一条条款;对于没有从合同中逐字复制的引用,则用模糊匹配来定位。我把这些智能体设置成一个阶梯,从彼此几乎相同到差异很大:
Claude Haiku 5.5,运行两次
同一模型,相同提示词
Claude Haiku 5.5,清单提示词
同一模型,不同指令
同一系列,更大的模型
不同系列,小模型和大模型
完全不同的方法
我按价格把这两个系列做了配对,因为 Haiku 5.5 和 GPT-6 luna 定价相同,Sonnet 5.5 和 GPT-6.1 sol 也是如此。整个运行花费 $14.71,涉及 294 个合约和 9 个智能体。
原文较长,译文为节选;译文由英文原文机器翻译,术语按行业惯例统一,可在文末展开原文核对。
查看英文原文(How to Estimate the Recall of AI Agents with Capture-Recapture)
I really like conifer trees. I like to walk in the forests and see the needles and cones.
You might be wondering why you're reading about this in an article about AI agents?
The story is that I moved to another country and wanted to find places where I could really enjoy walking among pine trees, but I couldn't find an easy way to do it, because this kind of walk isn't very popular there. So I started to build a map of conifer forests as a side project, something for people like me. The plan was to take the official forest inventory, find the named places inside it, and put them on a map. I thought the naming part would take an evening but in reality it took me a few days, and many, many tokens, just to figure out how to find and combine the data I wanted.
Names came from two sources: OpenStreetMap, which is drawn by volunteers, and the Ordnance Survey, the national mapping agency. My assumption was that between the two of them they would list nearly every named conifer forest in the country, so I just merged them and moved on.
Together they found 1,515 forests of 100 hectares or more. OpenStreetMap had 1,052 of them, Ordnance Survey had 1,190, and 727 were on both maps. Out of curiosity I put those three numbers into a calculation that fisheries scientists have used since the 1890s, and it said there should be about 1,722 forests, which means both maps together had missed around 207 of them, roughly 12%.
I was surprised, and a bit suspicious, because nobody has seen those 207 forests. How can a calculation know they exist?
Where the method comes from
Imagine you want to know how many fish live in a lake, but you can't drain it 🎣. You catch 100 fish, mark each one with a small tag and let them go, and a week later you catch 100 again. If 20 of the second catch carry a tag, your first catch was about a fifth of the lake, so the lake holds about 500 fish.
This is called capture-recapture. The Danish biologist C. G. J. Petersen used it on young plaice in the 1890s, Frederick Lincoln used it for North American ducks in 1930, and in 1951 Douglas Chapman added a small correction so it behaves better when the overlap is small.
Two maps work the same way as two catches. Each map is one net, the forests that appear on both maps are the recaptured fish, and the size of the overlap tells you how complete each map is and therefore how many forests neither of them caught.
The whole estimator fits in five lines:
def chapman(n1, n2, m, z=1.96): """Estimate the total from two independent catches. n1, n2: items found by each source; m: items found by both.""" N = (n1 + 1) * (n2 + 1) / (m + 1) - 1 var = (n1 + 1) * (n2 + 1) * (n1 - m) * (n2 - m) / ((m + 1) ** 2 * (m + 2)) return N, N - z * var ** 0.5, N + z * var ** 0.5N, lo, hi = chapman(n1=1052, n2=1190, m=727)
For the forests this gives an estimate of 1,722, with a 95% interval from 1,678 to 1,765.
The assumption that can break it
There's one big assumption behind all of this: the two sources need to be independent. In other words, a forest appearing on the first map shouldn't make it any more or less likely to appear on the second.
There are two obvious ways this can go wrong.
The first is the famous-forest problem. Some forests are on every map. If certain forests are easier for both sources to find, the overlap becomes too large and the estimate gets pushed down. In that situation, 12% is only a floor; the real gap could be larger.
The other possibility is that the two maps specialise in different things. Volunteers might gravitate towards parks and nature reserves, while a national survey might be more likely to include working plantation blocks. If each source is good at finding a different kind of forest, the overlap gets smaller and the estimate goes in the other direction, becoming too high.
I did a small check on this. Of 18 well-known forests I had picked earlier for another test, 10 appeared on both maps. That's 56%, compared with 48% for forests overall. It points slightly towards famous forests being easier to find, although 18 forests is far too small a sample to say much with confidence.
I couldn't actually test the 12% estimate directly, because there's no complete list of forests to compare it against. What stuck with me instead was the failure mode itself. The method breaks when the two sources share the same blind spots.
And this is leading me to a broader concern. Right now many teams are shipping AI agents and evaluating them with an LLM judge, often from the same model family as the agent itself. Moreover, the recent research shows that models from the same provider tend to make the same mistakes. So in many AI eval projects we may be measuring models with sources that share the same blind spots, and agreement between them can give us false confidence.
The same blind spot in AI evals
A while ago at work I helped build an AI agent that fills in contracts. The documents were mostly long contracts (employment contracts and service agreements), each at least 50 pages long and written in several languages. They are full of blanks for the same details again and again: names, addresses, dates of birth, company details. The idea was that nobody should have to type those details into every new document.
We already had the details of both parties stored, mapped to their role in a contract, so the first party is usually the company and the second party is the employee. The agent's job was to find every blank in the contract, work out which party and which detail it asks for and fill it in. If the contract says "Name of employee", the agent should put the employee's name there, and if it says "Date of birth", it should put 01-01-1990.
The contract-filling agent, step by step (image by author)
Qwen2.5-VL turns the scanned pages into text, Claude Haiku 5.5 finds the fields, the stored values go into them, and a person checks the result before it is sent.
I built the evaluation for this agent. It started as manual QA on 100 of these contracts, where reviewers went through the filled fields by hand, with a second LLM acting as a judge. Both checks ask the same question about each field the agent found:
But none of those checks measures the fields that nobody found.
If the agent puts a wrong value in a box, someone notices it and it gets corrected — simple, right? But if the agent never detected a field at all, it doesn't show up in any report.
When I saw two national maps agree on 727 forests and still miss 12%, I realised our checks had the same blind spot: the judge and the reviewers only look at what the agent already found, so nothing in the setup can ever see a field the agent missed. To count those fields you need a second source that searches the document on its own and even then it only works if the two sources don't tend to miss the same things.
Testing it on contracts with a full answer key
In general, AI eval can be checked, as long as you pick a task where someone has already labelled everything. For a new task, though, building that full answer key is expensive, and even careful manual labelling misses things.
The part below is not how you would use the method at work.
In production nobody has labelled your documents, and that is exactly why you would need an estimate in the first place. Here the labels play a different role. The estimator never sees them, it only gets a table of which agent found which quote, and I use the labels afterwards to grade its answer.
So think of this section as a worked example rather than a production setup. Because the right answer is known, it shows how the method behaves, where it goes wrong, and how much you can trust it on the day you use it without an answer key.
To show what this means in practice, I needed documents with a complete answer key, so I used CUAD, which has exactly that: 510 commercial contracts in which lawyers labelled every clause of 41 types.
I took the 294 contracts under about 10,000 tokens and 10 clause types that can appear several times in one contract, such as licence grants, liability caps, anti-assignment and audit rights. That gave 1413 labelled clauses, and this is the true number that every estimate below is checked against.
Each agent reads a contract once and quotes every clause of the 10 types, and then I match the quotes to the lawyers' labels. A quote counts as finding a clause when the two overlap by at least half of the shorter text, and quotes that aren't copied exactly from the contract are located with fuzzy matching. I set up the agents as a ladder, from near copies of each other to very different ones:
Claude Haiku 5.5, run twice
the same model with the same prompt
Claude Haiku 5.5, checklist prompt
the same model with different instructions
the same family, a larger model
a different family, small and large
a different method entirely
I matched the two families on price, since Haiku 5.5 and GPT-6 luna cost the same and so do Sonnet 5.5 and GPT-6.1 sol. The whole run cost $14.71 for 294 contracts and 9 agents.\
Most agents found about three quarters of the clauses:
Claude Haiku 5.5 (three runs)
127 of the 1413 clauses were missed by all seven agents, which is 9%, and that is quite close to the 12% the forests suggested.
Precision looks low, but part of that is the answer key itself. When I read some of the "false positives" by hand, several of them were real clauses that the lawyers hadn't labelled, so the labels have gaps of their own.
For every pair of agents I ran the five-line estimator and compared its answer with the true 1413.
Each dot is one pair of agents, with its 95% interval. The black line is the true count (image by author)
For every pair of agents I ran the five-line estimator and compared its answer with the true 1413:
Two runs of the same model estimated 1,102 clauses (22% below the truth).
Pairs from the same family landed between 1,149 and 1,243
Pairs from different families did better at 1,173 to 1,258
Pairs that included the keyword rules did about the same as those.
More than anything, I found the error bars interesting. Two runs of Haiku report a margin of about plus or minus 3 clauses around an answer that significantly underestimates the truth. This happens because the interval only measures sampling noise and knows nothing about shared blind spots, so two agents that agree a lot produce an estimate that is both too low and very confident. In a normal eval, high agreement between the agent and the judge is usually read as a good sign, and in this setting it is the opposite.
One thing I didn't expect was that the two OpenAI models were barely more alike than pairs across providers, while the Claude models were clearly alike. So "same family" doesn't mean one fixed amount of similarity, and I think it's worth measuring for whatever models you use.
Switching provider wasn't enough on its own either, because even the most different pairs were about 10% low.
Estimators that handle uneven difficulty
Ecologists ran into the same problem decades ago, because some animals are simply easier to trap than others. They built estimators that use more than two catches and look at how many animals were seen once, twice, three times and so on. Software engineers later used the same models to estimate how many defects were left after code inspections, and they found that with fewer than four inspectors no model was accurate enough and the underestimate could be large.
The simplest of these is the jackknife estimator from Burnham and Overton (1978), which needs only the counts of items seen by exactly one source and by exactly two:
def jackknife2(H): """Second-order jackknife (Burnham & Overton 1978). H: 0/1 matrix, rows = items found by at least one source, columns = sources.""" k = H.sum(axis=1) # how many sources found each item t = H.shape[1] f1, f2 = (k == 1).sum(), (k == 2).sum() return len(H) + (2 * t - 3) / t * f1 - (t - 2) ** 2 / (t * (t - 1)) * f2
With all 7 agents, the MAE dropped from about 12% for a pair of agents to about 5%. A log-linear model, which also learns which agents depend on each other, did about the same, and over all clauses it estimated 1360 against the true 1413.
Adding agents one by one (image by author)
This is the clearest picture of the idea above. Each new agent finds a few more clauses, and the estimate shows how much is still out there. Extra copies of the same model add very little, while the different models and the keyword rules move both lines.
Estimating each agent's recall without labels
An eval dashboard doesn't usually show how many clauses exist, it shows how good each agent is. Once you have an estimate of the total, though, each agent's recall is simply what it found divided by that total.
The common shortcut is pooled recall: you take everything any agent found, treat it as the full truth and measure each agent against it. Most teams I know do something like this, and in my opinion it's the forest blind spot again, because it assumes that whatever no agent found doesn't exist.
To make the test realistic I removed the labels completely. The agents' quotes are grouped into items and then a human checks a random 10% of those items. That check tells you how often an item seen by one agent, by two agents and so on is real.
True recall (black), pooled recall (red cross) and capture–recapture with a 10% audit (green square), for each agent (image by author)
Pooled recall overstated every agent's recall by 6 to 12 points, and Haiku looked like 86% when it was really 75%. The capture–recapture estimate with the small audit landed within 2 points of the truth for most agents. Across 1,000 bootstrap resamples of the contracts its median error was 3.8 points against 9.7 for pooling.
That's a really strong result! But not everything I predicted happened.
I expected two Haiku agents told to specialise in different types of clauses to overestimate (like the maps that specialise), but they still came out 18% low. Therefore, just giving the same model different focus instructions didn't always make its blind spots different.
I also expected agents from different families to give intervals that contain the truth, but they didn't, as the chart showed. Another test I wrote down beforehand also proved to be meaningless: if the true count is known, then the two-source estimate is just the truth divided by the agreement ratio, so the two are perfectly correlated by construction.
This exercise changed how I run our evals at work. These are the three changes that mattered most:
We stopped treating agreement as a good sign. A high agreement rate between the agent and the judge used to make us feel safe. Now we read it only as a check on the values the agent filled in, and it tells us nothing about the fields it missed.
We added a second extractor. Next to the Haiku agent, GPT Luna now reads the same OCR text on its own and lists every field it finds.
We report estimated recall next to precision. From the overlap between the two extractors, the first estimate said the agent was missing roughly 12% of the blanks, which until then had been left empty without anyone noticing.
More generally, this is what I would suggest to anyone evaluating an extraction agent:
Use at least three checkers and make one of them different. With three you can measure how much they depend on each other. The cheapest different checker in my test was a set of keyword rules, which found only half the clauses, but its blind spots were not the same as the LLMs.
If some items are easy for everyone, a two-source estimate will be too low, so use an estimator built for uneven difficulty.
A narrow interval from two checkers that agree a lot is a reason to look closer.
Audit a small random sample by hand. In my case 10% was enough to correct for false positives.
Report each agent's estimated recall. Most agent evals I've seen report only precision, and pooled recall made every agent here look better than it was.
If you already have an extraction agent, there is one check you can run this week. Run a second extractor over the same documents on its own, a different model or even a set of keyword rules, rather than a judge that grades the first one's output. Count the items both of them found, the items only the first one found and the items only the second one found, and put those three numbers into the five-line function. If the estimated total is well above what you've seen, your eval has been measuring precision on a list that was never complete.
All the code and the matched results are on GitHub.
And for anyone who wants to see the first version of my pine forest map, here is the link: evergreendaysout.co.uk (it's completely free!)
Burnham, K. P., & Overton, W. S. (1978). Estimation of the size of a closed population when capture probabilities vary among animals. Biometrika, 65(3), 625–633.
Briand, L. C., El Emam, K., Freimut, B. G., & Laitenberger, O. (2000). A comprehensive evaluation of capture–recapture models for estimating software defect content. IEEE Transactions on Software Engineering, 26(6), 518–540.
Hendrycks, D., Burns, C., Chen, A., & Ball, S. (2021). CUAD: An expert-annotated NLP dataset for legal contract review. Data on Zenodo, CC BY 4.0.
Kim, E. M., Garg, A., Peng, K., & Garg, N. (2025). Correlated errors in large language models. Proceedings of ICML, PMLR 267.
Forest counts: National Forest Inventory 2023 (Forestry Commission, OGL v3), OS Open Names (Ordnance Survey, OGL v3; contains OS data © Crown copyright and database right), OpenStreetMap © OpenStreetMap contributors (ODbL).
Teach your regressor how to output zero.
April 14, 20216 min read
It is Time to Reap The Fruits of Your Hard Marketing Mix Model Training!
July 3, 202310 min read
An explanation of the causal assumption implicit in prescriptive modeling and how to satisfy it
June 30, 202513 min read
A step-by-step guide to creating a local coding assistant without sending your data to the cloud
March 24, 20257 min read
How to set the right foundation for a successful data practice depending on your company's stage of Data Maturity
May 30, 202210 min read
How data science became a strikingly different discipline in the span of a couple of years (give or take)
October 16, 20253 min read
3 ways to finetune a CausalLM model on chat data
March 14, 20247 min read
A guided approach to assign new songs to Spotify playlists, using word2vec and logistic regression
November 23, 20222 min read
Lightweight graph RAG on Rotten Tomatoes movie reviews
June 12, 20259 min read
原文为英文,正文由自动抓取并保留原文。
原文发布于 Towards Data Science(How to Estimate the Recall of AI Agents with Capture-Recapture),标题、摘要与正文由机器翻译,术语按行业惯例统一,未经人工逐句校订。