历史报纸中女性选举权的计算分析
在1890年至1920年间,加利福尼亚州和纽约州哪几年对女性选举权的报道覆盖最高,且这两个州的趋势是否相似?
加利福尼亚州和纽约州都构成了有用的历史比较基础。在加利福尼亚州,女性选举权于1911年引入。在纽约州,一项选举权修正案于1915年失败,但于1917年通过。第十九修正案于1919年提交各州,并于1920年获得批准。
尽管这些日期可作为有用的背景,但它们并未被用来指导分析过程。虽然这项任务最初只被视为一项历史计数练习,但它却演变成了一个更广泛的测量问题。
这一问题不仅与历史报纸档案研究相关。处理数据集的专业人员必须应对数据集规模、构成、语言和质量随时间变化的情况。这可能意味着,所识别出的趋势要么归因于所观察现象的变化,要么归因于记录该现象的过程的变化。
数据集不是总体
数据来自美国国会图书馆的 Chronicling America 数据库,通过 Hugging Face 上的 Tim-Pinecone/LOC-Chronicling-America 数据集获取,并依据 CC0 1.0 许可。
每一行代表一页经过 OCR 的报纸,并包含标题、城市、年份及其他信息等数据。Parquet 文件通过 DuckDB 远程获取。
该数据集包含 600,546 页:其中 290,397 页来自加利福尼亚州,310,149 页来自纽约州。
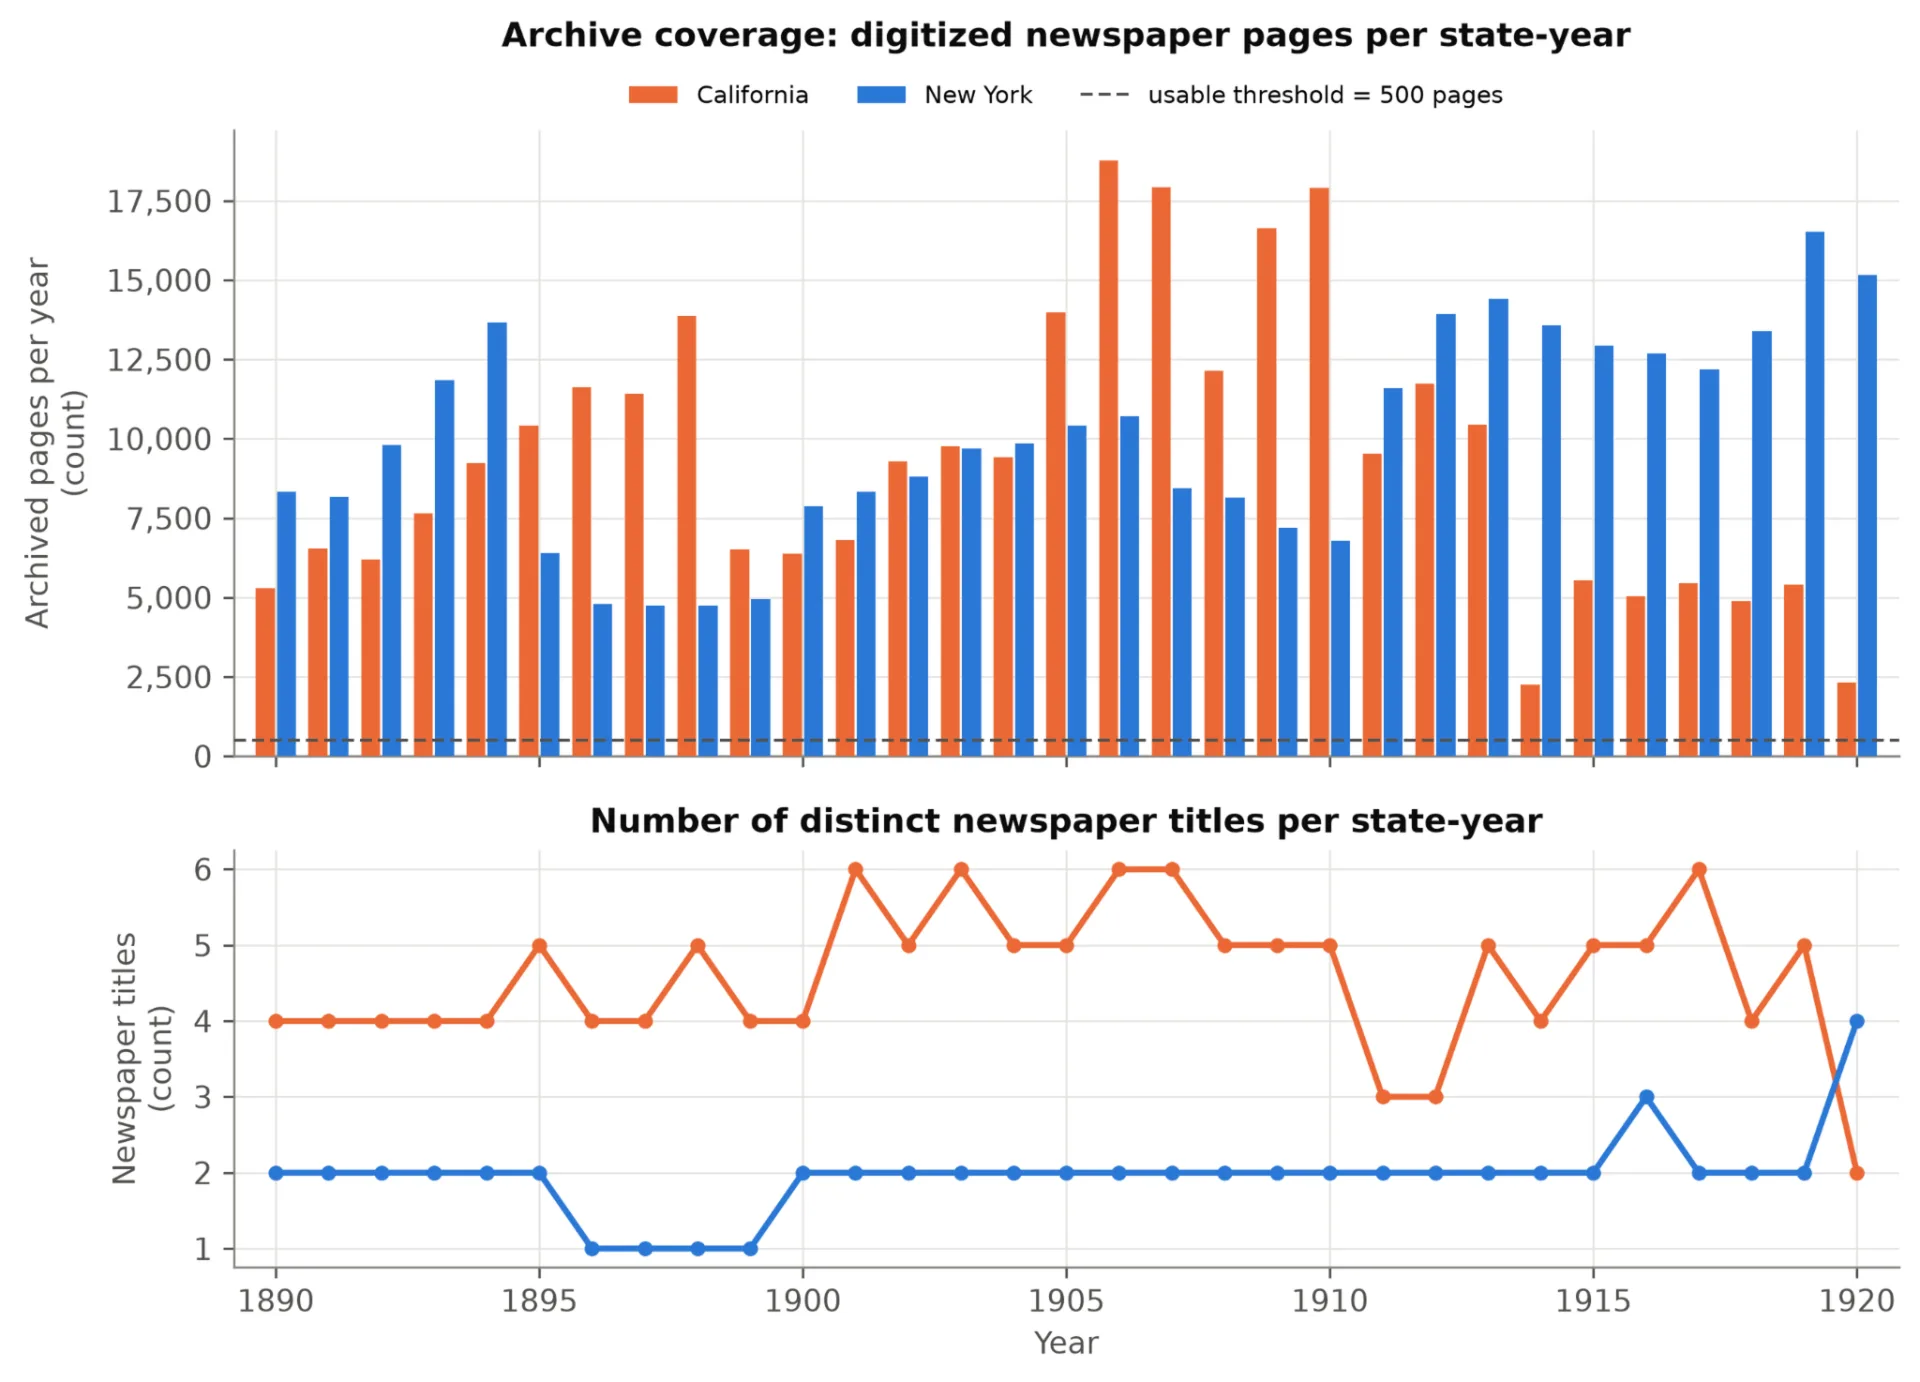
然而,该档案不能被视为新闻界的稳定样本。
在整个时间跨度内,一直收录了五种纽约报刊;在31年中的30年里,有一份报纸占据了超过一半的页面。有21种来自加利福尼亚的报刊,但没有任何一年有超过六种报刊被收录。
结论很清楚:
这些数据描述的是该档案,而不是整个报业。
定义“选举权关注度”
一个页面被定义为其中至少包含一个搜索词,无论该搜索词出现多少次。
严格查询使用六个短语:
更宽泛的对比查询会搜索 suffrage 的任何出现。
在整个样本期内,严格查询检索到 14,971 个匹配页面,而宽泛查询检索到 28,283 个匹配页面。
那么,「关注度」就是指包含上述短语之一的存档页面所占的比例。这一指标并不反映公众支持的程度。除了支持、反对、讽刺、广告和新闻之外,任何形式的关注都会被这一指标纳入。
为什么原始计数可能产生误导
原始计数混淆了两个不同的变量:(1) 档案库在该年份拥有的页面数量;(2) 这些页面中出现选举权的频率。即使比例保持不变,档案库页面数量的增加也会推高匹配数量。
在当前数据中也能看到这一点。在加利福尼亚州和纽约州,选举权相关页面原始计数与档案库规模之间的 Spearman 相关系数分别为 0.59 和 0.63。归一化之后,这两个相关系数分别降至 0.17 和 0.38。
在纽约州这一点非常容易看出。匹配页面数量最多的是 1913 年(1,227 个),而归一化后的比例则在 1909 年达到峰值。
加利福尼亚州也存在同样的问题。1914 年只有 96 个匹配页面,但当年档案库本身只收录了 2,248 个加州页面。归一化之后,1914 年反而是关注度最高的年份之一。
一个更普遍的启示是:当数据集规模随时间变化时,原始计数中也会包含有关数据集规模的信息。
所使用的关键指标为:
选举权率 =(匹配页面数 ÷ 归档页面数)× 10,000
指数为 50 意味着每 200 个归档页面中有 1 个匹配页面。
缺失值与零值被区分开来:零表示页面存在但没有匹配项,而缺失表示该特定州/年份完全没有证据。
归一化之后,两个州呈现出相似的趋势,包括 1890 年代的上升、1900 年代初的低水平,随后大约从 1908 年开始出现更强劲的激增。
在加利福尼亚州,峰值出现在 1913 年,为 735.9。
在纽约州,峰值出现在 1909 年,为 853.6,紧随其后的是 1913 年,几乎处于同一水平,为 851.9。
纽约州逐年增幅最大的一次出现在 1907 至 1908 年,该比率从 72.2 升至 406.1。
然而,需要注意的是,这些峰值需要验证。
搜索定义会改变叙事吗?
关键词查询是建模选择。
范围较窄的查询可能漏掉相关表述,而范围较宽的查询可能引入噪声。
严格序列与宽泛序列高度同步:它们的年度比率在加利福尼亚州的相关性为 0.94,在纽约州为 0.98。
宽泛查询找到的页面数量大约为严格查询的三倍。
但加利福尼亚州的峰值发生了变化。
严格查询在 1913 年达到峰值。
广义查询在 1896 年达到峰值。
因此,总体模式是稳健的,而确切的峰值则并非如此。
这一区分很重要:即便某个头条式的统计数字取决于模型,宽泛的结论仍可能保持稳定。
当一家报纸主导该州时
归一化处理了档案规模不平等的问题,但并未解决档案内容不平等的问题。
主要比率对每一页的权重是相等的。因此,占 80% 版面的报纸将贡献约 80% 的信号。
为了看出这两种度量之间的差异,研究使用了另一种度量方式,其中所有报纸的权重相等。
这两种度量在时间序列上的总体相关性非常高:加利福尼亚州为 0.96,纽约州为 0.997。
但在某些峰值时刻,它就变得重要了。
1909 年,纽约《太阳报》(The Sun)所刊页面的占比为 84%,选举权比率约为每 10,000 篇中 907 篇。因此,按页面权重计算的序列在 1909 年达到峰值。若每家报纸赋予相同权重,峰值则出现在 1913 年。这两种加权方法都没有错,但它们解决的是不同的问题。当所有页面权重相同时,1909 年是峰值。如果所有报纸权重相同,那么峰值是 1913 年。
加利福尼亚的语言问题
加利福尼亚提供了另一个案例研究。
从 1915 年到 1919 年,数据库中加利福尼亚的主要报纸是《L'Italia》,一份来自旧金山的意大利语报纸。
在连续七年的每一年里,意大利语、西班牙语和德语报纸都占加利福尼亚印刷页面的四分之一以上,1917 年更是高达 79%。
所使用的搜索词是英文。
在那些含有非英文内容的年份,加利福尼亚所有报纸的平均选举权比率为每 10,000 篇中 60.3 篇。
当计算仅限于英文报纸时,该比率升至 130.9。
尽管 1913 年之后的下降仍可观察到,但下降幅度的一部分归因于查询所依托的底层语料库的语言变化。
如果底层语料库发生变化,恒定的查询并不意味着恒定的度量。
变化点检验
视觉趋势可能会以回溯的方式影响叙事。
为了以系统的方式考察结构中的潜在变化,分析使用了 ruptures 包中的 PELT 方法进行变化点检测。
评估了四种惩罚项,只有当至少三种惩罚项在彼此相隔一年内检测到同一变化点时,该变化点才被视为稳定。
历史事件仅在变化点检测之后才被引入。
对于任一州,都没有检测到稳定的变点。
唯一一次检测发生在1908年前后的纽约,但仅出现在惩罚值最低的情况下。
这并不意味着该序列中没有变化;相反,纽约的上升始于1907年。
这意味着,相对于惩罚参数的合理取值,所检测到的变化并不稳定。
为了检测更多变点而降低惩罚值,会违背敏感性分析的目的。
零结果也能传递信息,尤其是当它们由预先确定的程序产生时。
为了考察与选举权相关的话语,各州被划分为四个时间段:
每个州-时间段最多纳入750个匹配页面,由此形成一个包含5,352页的NLP语料库。在排除英语停用词和原始检索词后,创建了一个包含一元词和二元词的TF-IDF模型。
这一过程发现了档案文本的另一个问题——许多显著术语更多与档案特征有关,而非与历史语言有关。
早期的纽约报纸包含许多 OCR 瑕疵,例如 “tbe”、“tbo” 和 “ofthe”。加州各时期有诸如 “los angeles”、“el centro” 和 “imperial valley” 这样的词,它们对应样本中占主导地位的那份报纸。加州后期的报纸则出现意大利语虚词,如 “della”、“che” 和 “sono”。
原文较长,译文为节选;译文由英文原文机器翻译,术语按行业惯例统一,可在文末展开原文核对。
查看英文原文(A Computational Analysis of Women’s Suffrage in Historical Newspapers)
A Computational Analysis of Women’s Suffrage in Historical Newspapers | Towards Data Science
In what years was there the highest coverage of suffrage for women in California and New York between 1890 and 1920, and were the trends similar in the two states?
Both California and New York constitute useful grounds for historical comparison. In California, women's suffrage was introduced in 1911. In New York, a suffrage amendment failed in 1915 but passed in 1917. The Nineteenth Amendment was transmitted to the states in 1919 and became ratified in 1920.
Though these dates serve as useful context, they are not used to guide the analysis process. While this task was originally seen as just a historical counting exercise, it turned into a wider problem of measurement.
This problem can be seen to be relevant not only to the study of historical newspaper archives. Practitioners dealing with datasets have to contend with cases when their size, composition, language, and quality change over time. This may mean that an identified trend is due either to the change in the phenomenon under observation or to a change in the process of recording it.
The dataset is not the population
The data come from the Library of Congress’ Chronicling America database, retrieved through the Tim-Pinecone/LOC-Chronicling-America dataset on Hugging Face and licensed under CC0 1.0.
Every line stands for an OCR’d page of a newspaper and includes data such as title, city, year, and other information. The Parquet files were retrieved remotely through DuckDB.
The dataset includes 600,546 pages: 290,397 from California and 310,149 from New York.
However, the archive cannot be considered to be a stable sample of the press.
Five New York titles have been included throughout the time span, and in 30 out of 31 years, one newspaper accounted for more than half of the pages. There are 21 titles from California, but in no year have more than six titles been present.
The bottom line is clear:
The data describe the archive, not the whole newspaper press.
Defining “suffrage attention”
A page is defined as having at least one search term within it regardless of how many times it appears.
The strict query uses six phrases:
A broader comparison query searches for any occurrence of suffrage.
There were 14,971 matching pages in the strict query search against 28,283 matching pages in the broad query search for the entire sample period.
“Attention,” then, is the share of archived pages that include one of the above phrases. This measure does not capture the level of public backing. In addition to support, opposition, satire, ads, and news, any form of attention is captured in this measure.
Why raw counts can mislead
A raw count mixes up two different variables: (1) the number of pages that the archive has for that year, and (2) how often suffrage is found in these pages. An increase in the number of pages in the archive can bring up the number of matches even when the rate stays the same.
It can be seen in the current data as well. There is a Spearman correlation between the raw suffrage-page count and the archive size for California and New York of 0.59 and 0.63, respectively. Once normalized, these correlations decrease to 0.17 and 0.38, respectively.
It is very easy to see in New York. There are the most matching pages in 1913 (1,227), while the normalized rate peaks in 1909.
There is the same problem in California. There are only 96 matching pages in 1914, but the archive itself contains only 2,248 California pages that year. When normalized, 1914 turns out to have one of the highest rates of attention.
A more general lesson is that when dataset size changes over time, raw counts contain some information about the dataset size as well.
The key indicator utilized is:
Suffrage Rate = (matched pages ÷ archived pages) × 10,000
An index of 50 would imply one matched page in every 200 archived pages.
While missing values were distinguished from zeroes, a zero means that pages were available but there were no matches, while missing means that there was no evidence at all for that particular state/year.
After normalization, both states show a similar trend, which includes a rise in the 1890s, low rates in the beginning of the 1900s and then a stronger surge starting roughly in 1908.
In California, the peak comes in 1913 at 735.9.
In New York, the peak comes in 1909 at 853.6, followed by 1913 at almost the same level at 851.9.
The greatest increase from one year to another in New York occurs from 1907 to 1908, with the rate rising from 72.2 to 406.1.
However, it should be noted that these peak values require verification.
Does the search definition change the story?
Keyword queries are modeling choices.
A narrow query can miss relevant language, while a broad query can add noise.
The strict and broad series track each other closely: their annual rates correlate at 0.94 in California and 0.98 in New York.
The broad query finds roughly three times as many pages.
But California’s peak changes.
The strict query peaks in 1913.
The broad query peaks in 1896.
The general pattern is therefore robust, while the exact peak is not.
That distinction matters: a broad conclusion can remain stable even when a headline statistic depends on the model.
When one newspaper dominates the state
Normalizing deals with the problem of archive size inequality but does not solve the problem of archive content inequality.
The main rate is equal in its weight for each page. Hence, a newspaper that accounts for 80% of the pages will provide about 80% of the signal.
In order to see the difference between these two measures, another measure was used in which all newspapers have equal weight.
The overall correlation between these two measures in the time series is very high: 0.96 for California and 0.997 for New York.
But it becomes important at certain peaks.
In 1909, the proportion of pages published by The Sun in New York was 84%, and the suffrage rate is about 907 out of 10,000. Therefore, the series based on page weight peaks in 1909. With the same weight for each newspaper, the peak occurs in 1913. Neither of the two methods of weighting is wrong, but they solve different problems. When all pages have the same weight, the year 1909 is the peak. If all newspapers have the same weight, then the peak is 1913.
California’s language problem
California provides another case study.
From 1915 through 1919, the main California newspaper in the database was L’Italia, an Italian-language newspaper out of San Francisco.
Italian-, Spanish-, and German-language newspapers accounted for over a quarter of the pages printed in California in each year of a seven-year stretch, rising as high as 79% in 1917.
The search terms used were English.
The average rate of suffrage for those years with non-English content was 60.3 per 10,000 among all California newspapers.
The rate rises to 130.9 when the calculation is limited to only English newspapers.
While the fall after 1913 can still be observed, part of the magnitude of the drop is due to the change in language in the underlying corpus of the query.
A constant query does not imply a constant measure if the underlying corpus varies.
Testing for change points
Visual trends could potentially affect storytelling in a backward-looking manner.
For examining potential changes in structures in a systematic way, the analysis used change-point detection by means of the PELT method in the ruptures package.
Four penalties were evaluated, and only a change point detected by at least three penalties within one year of each other was considered stable.
Historical events were introduced only after change-point detection.
No stable change point was detected as stable for either state.
The only detection took place around 1908 in New York, but only in the case of the lowest penalty.
It does not mean that there was no change in the series; on the contrary, the increase of New York starts in 1907.
What it means is that the change detected is not stable in relation to reasonable values of the penalty parameter.
Lowering the penalty in order to detect more change points would defeat the purpose of sensitivity analysis.
Null results can also carry information, especially when produced by a predetermined procedure.
To examine the discourse related to suffrage, the states were divided into four time periods:
Up to 750 matched pages per state-time period were included, resulting in an NLP corpus of 5,352 pages. After excluding English stop words and the original search terms, a TF-IDF model including unigrams and bigrams was created.
This process identified another issue with archival text – many salient terms would have more to do with archival features rather than with historical language.
The early New York papers contained many OCR artifacts, such as “tbe”, “tbo”, and “ofthe”. The California time periods had terms like “los angeles”, “el centro”, and “imperial valley”, which corresponded to the newspaper that was dominant in the sample. Late California papers featured Italian function words like “della”, “che”, and “sono”.
Thus, time-based NLP identified OCR quality, newspaper name, and language composition before identifying historical terms. However, a clearer historical trend emerged in the 1918-1920 New York time period with terms like “president wilson”, “war”, “league nations”, “amendment”, and “ratification” becoming prominent. While TF-IDF was helpful, it partially served as an indication of archival features.
What survived every check?
Several findings remained after changing the denominator, query definition, weighting scheme, and language assumptions.
Both states show a strong wave of suffrage attention from roughly 1908 to 1915.
That pattern survives normalization, title balancing, the broad query, and the language check.
The exact peak year is less stable than the overall trend.
New York peaks in 1909 under page weighting but 1913 under raw counts and title balancing. California peaks in 1913 under the strict query but 1896 under the broad query.
Archive composition materially changes the result.
One newspaper contributes 84% of New York’s pages in 1909, while non-English newspapers contribute as much as 79% of California’s archive in 1917.
A visible trend is not automatically a stable statistical regime shift.
No PELT breakpoint remained stable across the tested penalties.
What this analysis cannot tell us
Just because there is a discussion in the newspaper does not mean that public opinion has been affected. A periodical can discuss suffrage for a variety of reasons, such as support, opposition, ridicule, or simply because it is considered newsworthy.
Moreover, the analysis cannot determine cause and effect. The observed correlation between the times when peaks occurred during political events does not prove whether politics had an impact on the press or whether the press impacted politics.
This archive is not a representative sample of all of the press. In New York, there is only a small number of Manhattan newspapers discussed, while the composition of the newspapers in California varies over time.
OCR errors can distort the text. In a manual check of 40 matched pages, 37 turned out to be relevant, while two were false hits and one had no mention of women’s suffrage at all. Seven excerpts showed considerable damage done by OCR.
Therefore, the analysis studies what is possible to learn from the digitized archive.
What the archive teaches about data analysis
The initial question was one of history:
At what point did newspaper coverage of women’s suffrage hit its peak?
A more practical question of methodology emerged:
How consistent is the same pattern when the dataset itself is part of the problem?
While the broad 1908–1915 wave continued, the specific peaks were no longer consistent.
The California dip became less pronounced after accounting for language composition.
The New York peak of 1909 lost some strength following correction for concentration of newspapers.
Additionally, the NLP analysis often found shifts in the archive that preceded language changes.
The larger implications are clear:
- Figure out the denominator before interpreting the numerator.
- Distinguish missing data from zeroes.
- Observe the composition of sources changing.
- Analyze both the number and the language of documents.
- Treat the search terms as model choices.
- Check OCR output manually.
- Expect NLP to show characteristics of the dataset itself.
- Test if the statistical result holds with other plausible configurations.
Archival text data are not simply waiting to be counted but rather are dynamic samples. The aim is not to perfect all the samples but to find which results hold up after their imperfections are made clear.
The analysis uses the Library of Congress Chronicling America corpus through the Tim-Pinecone/LOC-Chronicling-America Hugging Face dataset.
The version used in the analysis corresponds to Hugging Face commit:
781d9ba6cb605320764bec3fdcecad6c0c263096
All 62 state-year queries were collected between October 24 and October 25, 2026 UTC.
The pipeline was written in Python and uses DuckDB for remote Parquet queries, pandas and NumPy for processing, ruptures for change-point detection, scikit-learn-compatible TF-IDF processing for text analysis, and Matplotlib for figures.
NLP sampling is deterministic using md5(_id) ordering, while manual QA sampling uses a fixed random seed.
rebuilds the collected aggregates, analysis, NLP outputs, figures, and reports and performs the project’s validation checks.
The final run completed all validation checks successfully.
Image provenance: All analytical figures and visualizations in this article were created from the results of this analysis.
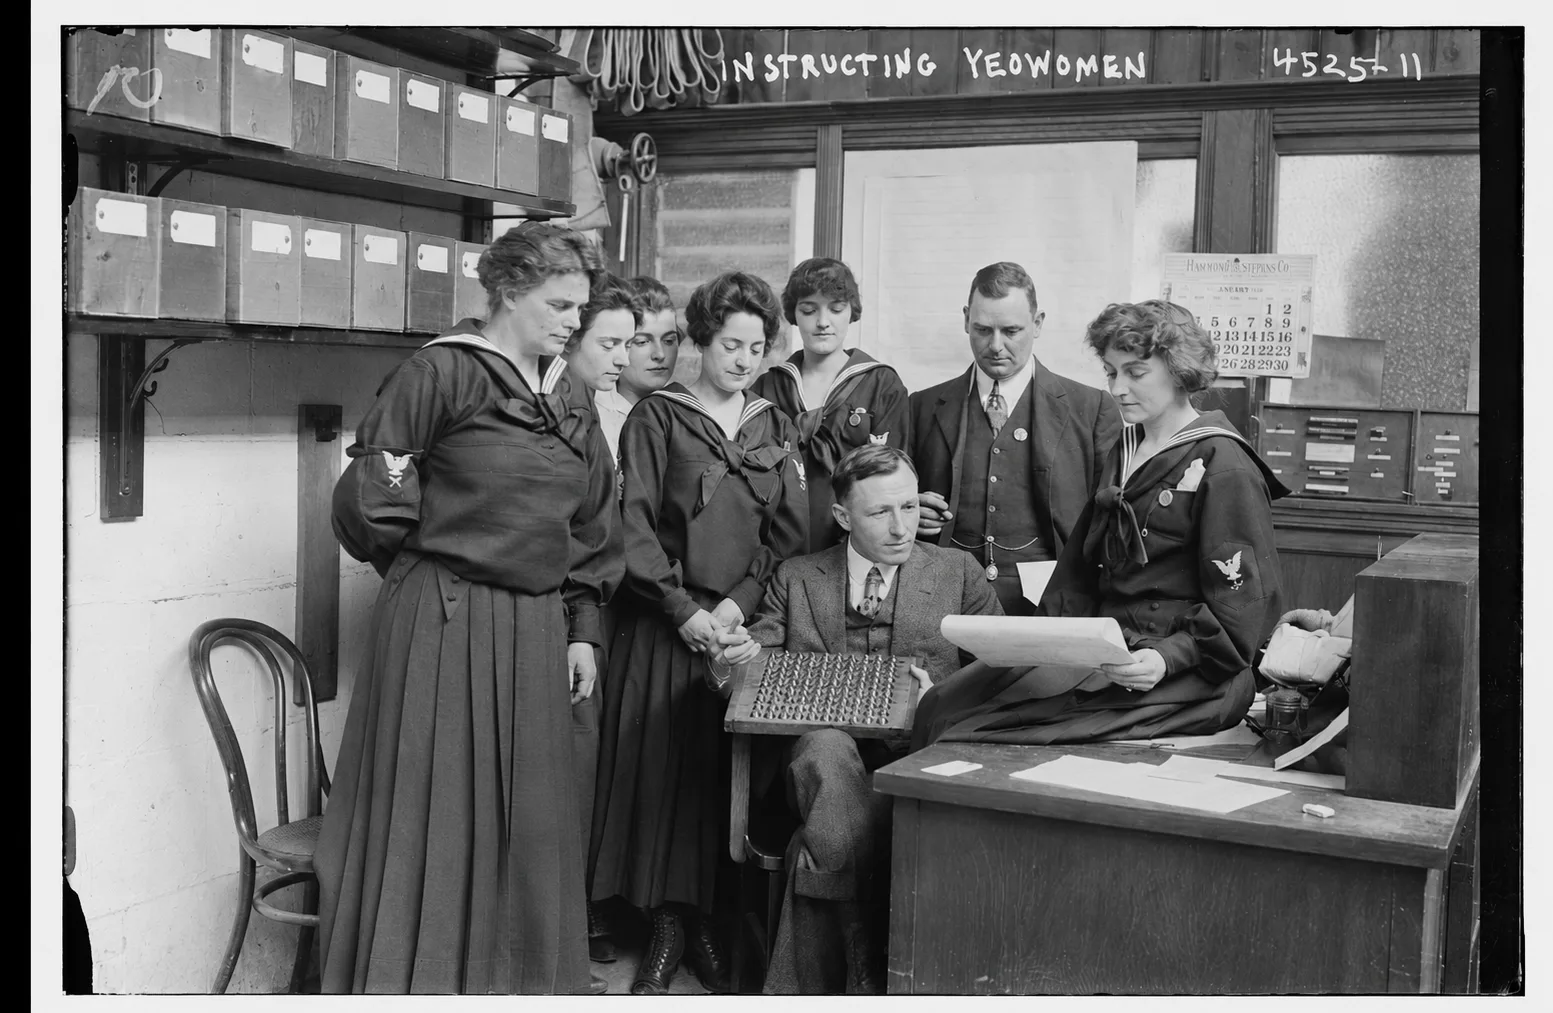
Featured image: Bain News Service, Instructing Yeowomen, ca. 1915–1920. George Grantham Bain Collection, Library of Congress Prints and Photographs Division. No known restrictions on publication.
Library of Congress. Chronicling America: Historic American Newspapers. National Digital Newspaper Program, Library of Congress and National Endowment for the Humanities.
Condello, Tim. Chronicling America: Nationwide Partitioned Apache Parquet Newspaper Dataset. Hugging Face, 2026.
California Secretary of State. History of Women’s Suffrage in California.
National Park Service. The Fight for Women’s Suffrage: It Happened in New York, Finally.
National Archives and Records Administration. 19th Amendment to the U.S. Constitution: Women’s Right to Vote.
Library of Congress. Chronicling America — Technical Information: Optical Character Recognition.
DuckDB. HTTP Parquet Import / HTTP(S) Support Documentation.
Truong, C., Oudre, L., and Vayatis, N. ruptures: Change Point Detection in Python.ruptures documentation.
Killick, R., Fearnhead, P., and Eckley, I. A. “Optimal Detection of Changepoints With a Linear Computational Cost.” Journal of the American Statistical Association, 107(500), 2012, pp. 1590–1598.
Scikit-learn. Feature Extraction: TF–IDF Term Weighting.
Learn the most important pillar of data science
July 15, 20205 min read
How to use Google Colab in a very advantageous style
Learn how to improve the performance of your OpenSearch cluster to ultimately accelerate your workloads
September 21, 20228 min read
Unveiling the power of Prediction Intervals
March 29, 20246 min read
Learn a valuable combination of different Embeddings
November 28, 20194 min read
Common data analyst questions answered
November 14, 20205 min read
A focus on privacy in Machine Learning
October 6, 20204 min read
The real shift is bigger than productivity: AI is reshaping ownership, judgment, and the career path of data scientists.
September 29, 202610 min read
Using Polars with NVIDIA GPU can speed up your data pipelines
September 17, 20244 min read
原文为英文,正文由自动抓取并保留原文。
原文发布于 Towards Data Science(A Computational Analysis of Women’s Suffrage in Historical Newspapers),标题、摘要与正文由机器翻译,术语按行业惯例统一,未经人工逐句校订。