Unity Gateway Insights 正式发布

在设法削减 AI 成本时,团队往往从预算或开源模型入手。但智能体追踪记录还能揭示其他节省机会。在 Databricks,追踪分析暴露了若干机会:离线回放显示,从 Opus 4.8 升级到 Opus 5 并没有带来性能提升,于是我们继续使用更便宜的 4.8;修复常见的 MCP 错误,一年估计节省了 120 万美元成本;追踪记录还显示,简单的提示词被发送给了昂贵的模型,这促使我们采用了 Smart Routing。
今天,我们推出 Unity Gateway Insights,它自动使用 Genie,结合你的业务数据和本体来分析数百万条智能体追踪记录。它会指出 Token 在哪里被浪费:反复出现的 MCP 错误、在昂贵的前沿模型上运行的简单任务,以及值得转化为共享技能的重复工作流,而这一切都在你的业务语境下、并与其他数据遵循同一套治理。
如果你已经有流量通过 Unity Gateway,请打开 AI Gateway > Observability > Insights,为过去 1 天、7 天或 30 天生成报告。随后 Insights 会就你的编码智能体部署的 Token 经济学写出一份报告,回答以下问题:
人们在做什么?Insights 会将每个工作流的会话占比与 Token 占比进行对比。一个占据 10% 会话、却消耗 35% Token 的工作流,就是第一个该看的地方。
我在哪里可以省钱?Insights 会展示 Token 的去向,并按成本高低对各类浪费进行排序。对于每个重复工作流,Insights 会写出一段提示词,你可以复制它,把该工作流变成共享技能。
每条发现都链接到示例会话,因此你可以打开其背后的追踪记录。
你最多可以向报告添加 10 个自定义问题,比如最新模型是否值得用于你团队的工作。想进一步深挖,就继续与 Genie 对话。问一问你数据中这个月哪个 MCP 服务器浪费的 Token 最多、归谁负责,你就得到了一份可以直接发出的 bug 报告。
Insights 从你的追踪数据中能发现什么
以下是 Insights 报告的每一类浪费背后的情况:
MCP 错误与浪费:当一次工具调用失败时,智能体会重试或绕过它,直到任务完成,于是整个会话看起来是成功的,而你要为每一次重试付费。我们发现的这 120 万美元浪费,仅来自我们 MCP 服务器中的七个小 bug:49.9 万美元的浪费 Token,外加工程师等待智能体所耗费的 12,000 小时。修复全部七个 bug 只用了大约一个小时。
模型使用低效:Insights 会评估每个前沿模型会话中任务的复杂程度,并统计其中那些快速、常规的会话及其消耗的 Token。这些正是 Smart Routing 可以转交给更便宜模型处理的会话,同时把前沿模型留给真正需要它们的工作。
值得固化的常见工作流:当一个工作流在至少三个会话中重复出现,或在两名工程师之间重复出现时,才被计入。共享技能会把这些步骤预先提供给智能体,这样你就不必再为它每个会话都重新摸索这些步骤而付费。
你数据平台上的 AI 控制平面
要发现这类浪费,需要完整记录每个智能体会话的每一步:输入与输出、工具调用、子智能体、中间步骤、延迟和 Token 成本。独立网关只记录经过它的请求。要捕获每个会话的其余部分,就需要你自己为每个编码智能体做埋点,再把追踪数据导出到数据平台进行分析。
把 Claude Code 指向这些追踪数据,仍然需要你自己设计调查方式,而且没有像 Genie Ontology 那样提供一张业务全景图。Insights 会运行我们在向数千名 Databricks 工程师推广编码智能体过程中开发出的调查流程。它会对会话进行采样,并按工作类型将其归入不同的工作流。然后检查每个工作流是否存在 MCP 工具失效、上下文膨胀、前沿模型被用于简单任务以及重复工作流等问题,并按所涉 Token 数量对发现结果排序。它依赖四项独立网关无法具备的条件:
每个智能体都被自动追踪。Unity Gateway 是你的编码智能体请求所经过的控制平面。当工程师通过 ug CLI 启动 Claude Code、Codex 或 GitHub Copilot 时,ug 会自动开启每个智能体自身的 OpenTelemetry 追踪,因此你的团队无需做任何埋点。追踪数据落入统一追踪表——一张归你所有的、受治理的 Delta 表,位于 Unity Catalog 中,采用任何工具都可读取的开放格式。
了解你业务的 Genie。Genie 负责编写 SQL 并读取会话。借助 Genie Ontology,它的回答会使用你自己的项目名称和业务细节。
可支撑数百万条追踪数据的规模。Databricks SQL 能查询你的全部历史追踪数据,其规模和性能与处理你最大的表时相同。
默认锁定。追踪数据包含提示词、代码和工具输出,因此在管理员通过 Unity Catalog 授权和行过滤授予访问权限之前,只有表的所有者可以查询。Insights 就地读取该表,因此你无需导出最敏感的数据即可进行分析。
如果你的开发者已经通过 Unity Gateway 运行编码智能体,今天就可以生成第一份报告:
设置统一追踪表,让 Unity Gateway 记录追踪数据。
让你的团队使用 ug CLI 启动他们的编码智能体。
在你的工作区中,打开 AI Gateway > Observability > Insights 并生成报告。详情请参阅 Insights 文档。
在收件箱中获取最新文章
译文由英文原文机器翻译,术语按行业惯例统一,可在文末展开原文核对。
查看英文原文(Introducing Unity Gateway Insights)
When looking to cut AI costs, teams often start with budgets or open-source models. But agent traces can reveal other opportunities to save. At Databricks, trace analysis surfaced several: offline replays showed no performance gain from upgrading from Opus 4.8 to Opus 5, so we stayed on the cheaper 4.8; fixing common MCP errors recovered an estimated $1.2M in costs a year; and traces showed that simple prompts were going to expensive models, prompting us to adopt Smart Routing.
Today, we’re introducing Unity Gateway Insights, which automatically uses Genie to analyze millions of agent traces alongside your business data and ontology. It surfaces where tokens are being wasted: MCP errors that keep recurring, simple tasks running on expensive frontier models, and repeated workflows worth turning into shared skills, all in the context of your business and under the same governance as your other data.
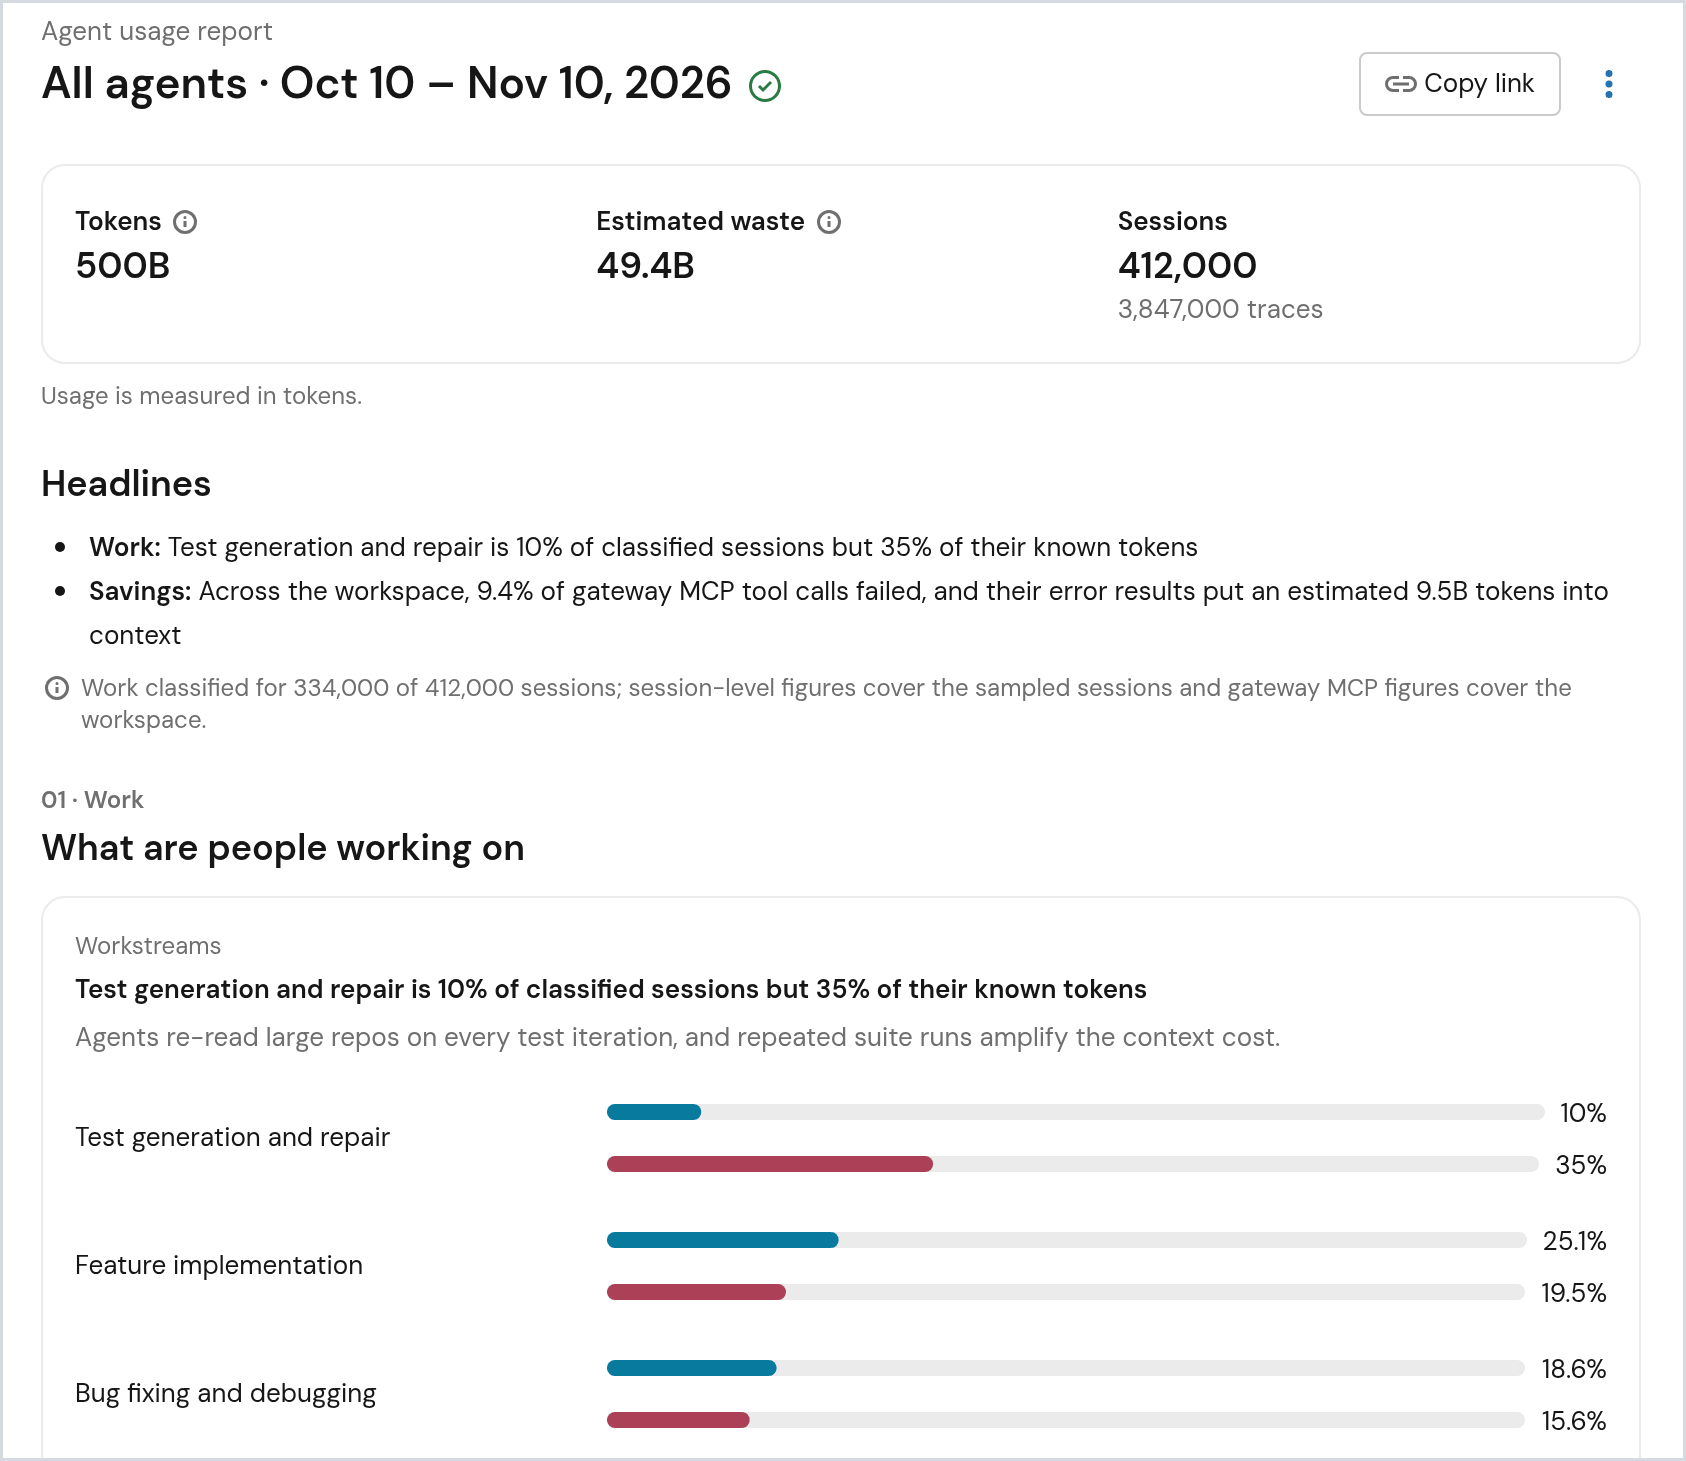
If you already have traffic flowing through Unity Gateway, open AI Gateway > Observability > Insights and generate a report for the last day, 7 days, or 30 days. Insights then writes a report on the tokenomics of your coding agent rollout that answers the following questions:
What are people working on? Insights compares each workstream's share of sessions with its share of tokens. A workstream with 10% of sessions and 35% of tokens is the first place to look.
Where can I save money? Insights shows where tokens go and ranks each kind of waste by what it costs. For each repeated workflow, Insights writes a prompt you can copy to turn that workflow into a shared skill.
Each finding links to example sessions, so you can open the traces behind it.
You can add up to 10 questions of your own to a report, such as whether the newest model is worth it for your team's work. To dig further, continue the conversation with Genie. Ask which MCP server wasted the most tokens this month and who owns it, and you have a bug report ready to send.
What Insights finds in your traces
Here's what's behind each kind of waste Insights reports:
MCP Errors & Waste: When a tool call fails, agents retry or work around it until the task gets done, so the session looks like it worked while you pay for every retry. The $1.2M we found came from just seven small bugs in our MCP servers: $499K in wasted tokens plus 12,000 hours of engineers waiting on agents. Fixing all seven took about an hour.
Inefficient Model Usage: Insights rates how complex the task was in each frontier-model session and counts the quick, routine ones, along with the tokens they used. Those are the sessions Smart Routing can send to a cheaper model while keeping frontier models for the work that needs them.
Common workflows to codify: A workflow counts when it recurs in at least three sessions or across two engineers. A shared skill gives agents those steps up front, so you stop paying for them to work the steps out again every session.
The AI control plane on your data platform
Finding this kind of waste requires a full record of every step of every agent session: inputs and outputs, tool calls, subagents, intermediate steps, latency, and token cost. A standalone gateway records only the requests that pass through it. Capturing the rest of each session means instrumenting every coding agent yourself, then exporting the traces to a data platform to analyze them.
Pointing Claude Code at those traces still leaves you to design the investigation yourself, with no map of your business like the Genie Ontology provides. Insights runs the investigation we developed while rolling out coding agents to thousands of Databricks engineers. It samples sessions and groups them into workstreams by kind of work. Then it checks each workstream for failing MCP tools, bloated context, frontier models on simple tasks, and repeated workflows, and ranks what it finds by the tokens at stake. It depends on four things a standalone gateway can't have:
Every agent traced automatically.Unity Gateway is the control plane your coding agent requests go through. When engineers launch Claude Code, Codex, or GitHub Copilot with the ug CLI, ug turns on each agent's own OpenTelemetry tracing automatically, so your teams have nothing to instrument. Traces land in the unified trace table, a governed Delta table in Unity Catalog that you own, in an open format any tool can read.
Genie that knows your business. Genie writes the SQL and reads the sessions. With Genie Ontology, its answers use your own project names and business nuances.
Scale for millions of traces. Databricks SQL queries your full trace history with the same scale and performance it brings to your largest tables.
Locked down by default. Traces hold prompts, code, and tool output, so only the table's owner can query it until admins grant access with Unity Catalog grants and row filters. Insights reads the table in place, so you never export your most sensitive data to analyze it.
If your developers already run coding agents through Unity Gateway, you can generate your first report today:
Set up the unified trace table so Unity Gateway records traces.
Have your teams launch their coding agents with the ug CLI.
In your workspace, open AI Gateway > Observability > Insights and generate a report. See the Insights documentation for details.
Get the latest posts in your inbox
原文为英文,正文由自动抓取并保留原文。
原文发布于 Databricks Blog(Introducing Unity Gateway Insights),标题、摘要与正文由机器翻译,术语按行业惯例统一,未经人工逐句校订。