连续10次正面后,小型LLM押注第11次达82%
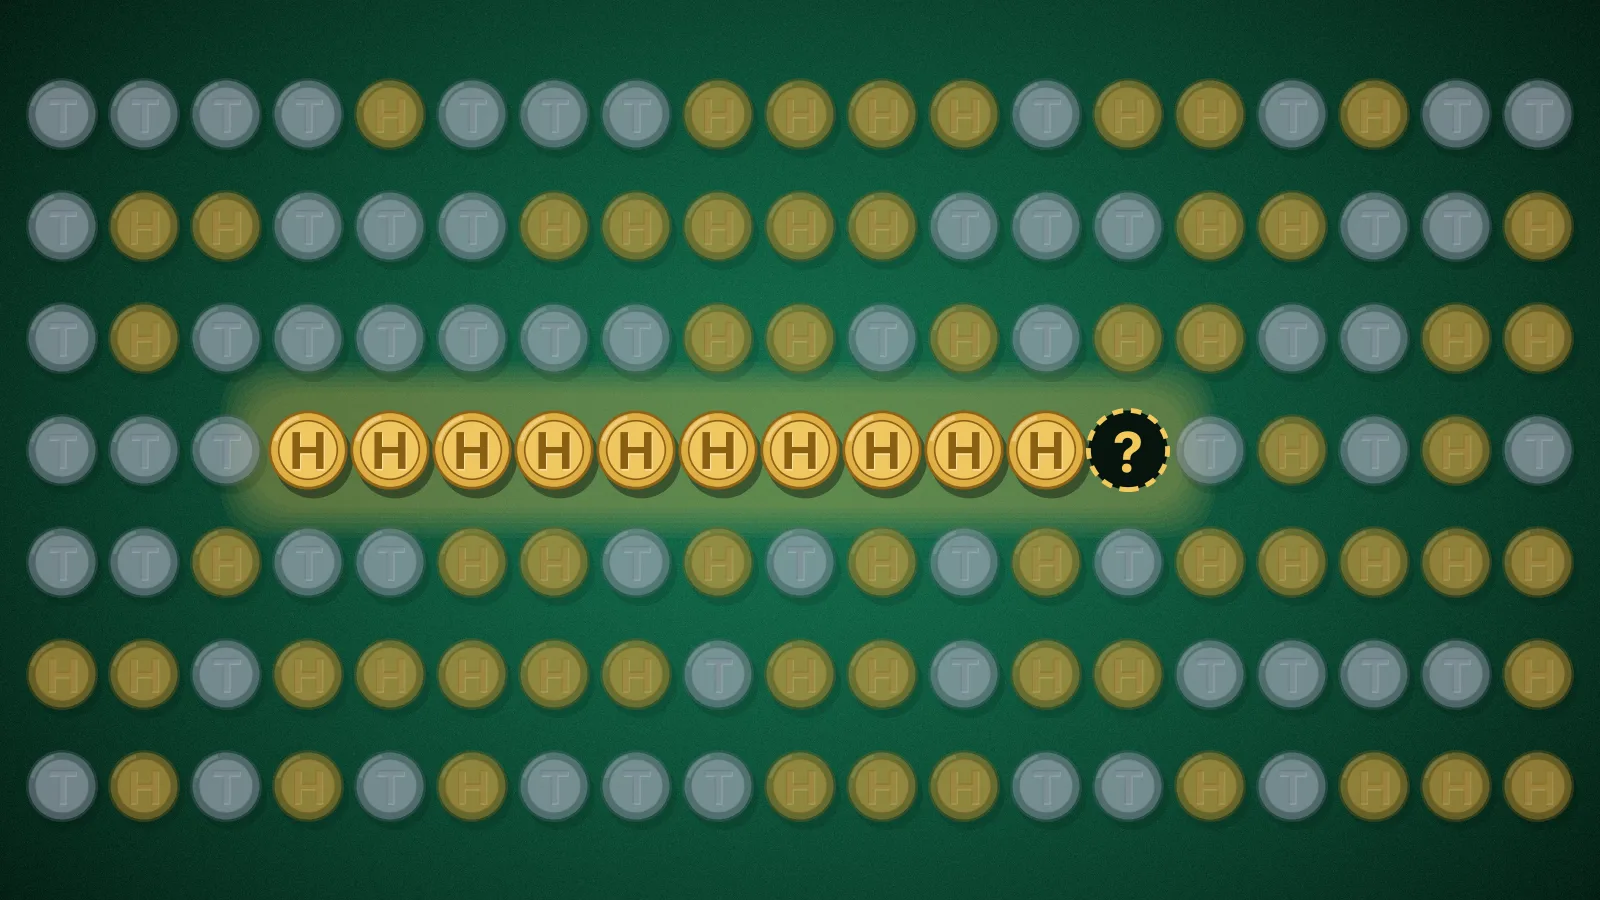
对 8 个 LLM 的赌徒谬误测试发现连串偏差
故事是这样的:1913 年 8 月 18 日夜里,蒙特卡洛赌场的轮盘球连续 26 次停在黑色上。大约在第 10 次黑色前后,赌客们开始把钱押到红色上,确信这么长的连串必定会中断。它没有中断,而通常的说法是他们输掉了数百万法郎。不同版本的细节各有出入,所以我会对具体数字持宽松态度。这个故事背后的错误真实到有了一个名字:赌徒谬误。
人类一直在犯这个错误。我想知道语言模型是否也会这么做,而且我想用一种不依赖于聊天模型回答冷知识问题时有多礼貌的方式来判断。问“连续五次正面后,硬币是不是该出反面了?”测试的是模型会说什么。读取它的下一个 Token 概率测试的是它预期什么。这两者可能以有趣的方式分离。
为什么硬币不会“该出了”
取一枚公平硬币。连续出现五次正面的概率是 1/32:
P(HHHHH)=(12)5=132P(\text{HHHHH}) = \left(\tfrac{1}{2}\right)^5 = \tfrac{1}{32}P(HHHHH)=(21)5=321
连续五次正面后再出现一次反面的概率是 1/64,正好是前者的一半。所以,如果你刚看到连续五次正面出现,下一次抛掷出现反面的概率是
P(T∣HHHHH)=P(HHHHH, then T)P(HHHHH)=1/641/32=12P(\text{T} \mid \text{HHHHH}) = \frac{P(\text{HHHHH, then T})}{P(\text{HHHHH})} = \frac{1/64}{1/32} = \frac{1}{2}P(T∣HHHHH)=P(HHHHH)P(HHHHH, then T)=1/321/64=21
这段连续纪录才是罕见的部分。一旦它已经发生,它就只是历史,而硬币根本无从读取它。同样的计算适用于任意长度的连续纪录:这段连续(此处为 1/32)的罕见程度,总会与「这段连续再加一次抛掷」的罕见程度相互抵消,剩下的就是 1/2。
它仍然让人觉得不对劲,而这种感觉已经被研究很久了。Tversky 和 Kahneman 把这种潜在的习惯称为信奉「小数定律」:人们期望即便是很短的序列也看起来像长期平均值,因此一连串正面会让人觉得硬币欠了债 [2]。这不仅仅是一种课堂效应。Chen、Moskowitz 和 Shue 在庇护案法官、信贷员和棒球裁判身上发现,其决策存在负自相关,且与案件本身的是非曲直无关,他们将其解读为与赌徒谬误相符 [1]。
一条不是谬误的经验法则
有一个关键点对这个实验很重要。以上所有推论都假设你知道这枚硬币是公平的。如果你不知道,那么一段连续纪录就是证据。
把「我对这枚硬币一无所知」形式化的经典方法是拉普拉斯接续法则:在 n 次抛掷中出现 h 次正面后,下一次为正面的概率估计为
\hat{p} = \frac{h + 1}{n + 2}
在五次抛掷全部为正面之后,这个值是 6/7,约 86%。一个对硬币最初没有既定看法的观察者,应当预期这段连续会继续下去,因为连续五次正面正是严重偏斜的硬币会产生的现象。因此,一个在连续纪录之后预期其延续的模型,并不自动是在犯谬误。它可能只是在就一枚未知的硬币进行推理。
这就是我把每个测试都跑两遍的原因:一遍不描述硬币,一遍在提示词中直接说明这是一枚公平硬币、各次抛掷相互独立。在第二个版本中,无论连续同面的长度是多少,正确答案都是 1/2,没有任何回旋余地。
已有研究,以及我要挑的那个空白
我不是第一个让语言模型做抛硬币的人。Bigelow 和同事研究了随机二进制序列上的上下文学习,发现某些 GPT 模型生成的序列中出现类似赌徒谬误的模式,交替(正反切换)的次数多于随机预期 [3]。Van Koevering 和 Kleinberg 把 LLM 生成的抛硬币序列与人类写出的序列做了比较 [4]。Mondal 和同事提出,模型陈述的答案与它计算出的概率可能不一致,他们把这称为「显露的信念」与「陈述的答案」之间的差异 [5]。
不过,就我所能查到的范围而言,还没有人把这些线索拼合到这里的这个具体问题上:面对一个真正随机的序列,随着连续同面的长度增加,模型对下一次抛掷的概率如何变化?告诉它硬币是公平的,能否纠正这一点?这又与同一个模型在被直接询问时给出的说法是否一致?这正是我所测量的。
如何解读模型对一枚硬币的「信念」
语言模型不会输出「正面」或「反面」。它输出的是其词表中每个 Token 的概率。如果我在一串写作 H T T H H 的抛掷结果之后结束提示词,那么模型对 Token H 和 T 的概率就是它对下一次抛掷的猜测。只在这两个 Token 上重新归一化,就得到一个我可以直接读取的数字:模型认为出现正面的概率。
有个很方便的技巧。模型从左到右读取序列,因此对整条序列做一次前向传播,就能得到每个位置上该次抛掷的概率,而每一个都只依赖于它之前的抛掷结果。我用 NumPy 生成一条随机序列,一次性喂进去,就能读出模型在每一次抛掷之前的信念。
import numpy as np, torch def p_heads_before_each_flip(model, tok, header, flips): # flips:由 0/1 组成的数组,其中 1 = 正面 base = tok(header)["input_ids"] id_H = tok(header + " H")["input_ids"][-1] id_T = tok(header + " T")["input_ids"][-1] ids = base + [id_H if f else id_T for f in flips] with torch.no_grad(): logits = model(torch.tensor([ids])).logits[0, len(base) - 1 : -1].float() return torch.sigmoid(logits[:, id_H] - logits[:, id_T]).numpy()
两个 logit 之差的 sigmoid 值,就是在 H 和 T 上重新归一化之后正面的概率。切片 len(base) - 1 : -1 选取的是预测第 0、1、2 次等抛掷结果的那些位置。
然后我按每次抛掷之前连续相同结果的长度对这些概率分组,并把它们转换成“连续继续下去的概率”:
def streak_and_p_repeat(flips, p_heads, r_max=10): p_repeat = np.where(flips[:-1] == 1, p_heads[1:], 1 - p_heads[1:]) run = np.ones(len(flips), dtype=int) for j in range(1, len(flips)): run[j] = run[j - 1] + 1 if flips[j] == flips[j - 1] else 1 return np.minimum(run[:-1], r_max), p_repeat
在许多序列上,对每个连续长度内的 p_repeat 取平均,就得到一条曲线。由于这些序列是真正随机的,无论连续长度是多少,真实答案都是 0.5。曲线上任何偏离这一点的值,都是模型自身先验的泄漏,因为随机序列中没有任何可供它学习的东西。
这里有一项合理性检查很重要。如果某个模型把大部分概率放在其他某个 Token 上,比如换行符或单词“The”,那么重新归一化后的 H 与 T 数值衡量的就只是它注意力的一小部分。所以我会记录每个模型、每个提示词下落在 H 和 T 上的总概率有多大。
我使用了四个开放模型家族,每个都分别以基础模型和指令微调版本的形式出现:Qwen2.5(1.5B 和 3B)、SmolLM2-1.7B 和 OLMo-2-1B。对比基础模型与指令模型是刻意的。指令微调是模型被训练得明事理、有帮助的阶段,我想看看它是会消除某种偏差、增加某种偏差,还是毫无影响。
对每个模型,我生成了 1,200 条随机序列,每条包含 60 次公平抛掷,这些序列在各模型间共享,因此每个模型看到的数据完全相同。这样每条序列可得到 59 个预测,曲线按连串长度对它们取平均,95% 置信区间则来自对整条序列的重采样。
第一类是主要的一类:两组提示词开头下的连串曲线。普通开头只写着“这是一串抛硬币记录(H = 正面,T = 反面):”。公平硬币开头则说明这枚硬币是公平的,且每次抛掷都与之前的结果相互独立。
第二类对比的是“说”与“做”。为了得到模型“说的”内容,我提了一个多选题:一枚公平硬币(或一个理想化的轮盘)连续 k 次落在同一面,k 从 3 到 12,模型在“低于 50%”“正好 50%”和“高于 50%”之间选择再一次重复的概率。我把选项顺序打乱了,因为模型对字母有偏好。为了得到指令模型“做的”内容,我展示了 24 次随机抛掷、末尾植入一段指定长度的连串,并以模型的对话格式要求给出下一次抛掷结果,然后读取答案位置中 H 和 T 的概率。
第三项是可学习性检查。我又构造了另外两种数据:一种中每次抛掷结果以 0.7 的概率重复前一次结果,另一种以 0.3 的概率重复,也就是「连号型」和「交替型」硬币。如果模型在公平硬币上的行为是一种顽固的先验,它就应该无法适应这两种数据。如果它只是一个可被证据推翻的默认倾向,它就应该跟随数据。
模型在连续出现同一结果之后会预期什么
图 1 是核心结果。虚线是公平硬币下的正确答案。第一行中的点线,是一个对硬币没有任何先验看法的理想学习者的预期值,因此它显示了在你不知道硬币是公平的前提下,一段连号最多能把预期推到 0.5 以上多远的位置。
原文较长,译文为节选;译文由英文原文机器翻译,术语按行业惯例统一,可在文末展开原文核对。
查看英文原文(After 10 Heads in a Row, Small LLMs Bet Up to 82% on an 11th)
Gambler's Fallacy Test on 8 LLMs Finds a Streak Bias
On the night of 18 August 1913, the story goes, a roulette ball at the Casino de Monte-Carlo landed on black 26 times in a row. Somewhere around the tenth black, gamblers started piling money onto red, sure that a streak that long had to break. It didn't, and the usual retelling is that they lost millions of francs. The details vary from one retelling to the next, so I'd treat the exact numbers loosely. The mistake behind the story is real enough to have a name: the gambler's fallacy.
Humans make it constantly. I wanted to know whether language models do, and I wanted to know in a way that doesn't depend on how politely a chat model answers a trivia question. Asking "is a coin due for tails after five heads?" tests what a model says. Reading its next-token probabilities tests what it expects. Those two can come apart in interesting ways.
Why the coin can't be due
Take a fair coin. The chance of five heads in a row is 1/32:
P(HHHHH)=(12)5=132P(\text{HHHHH}) = \left(\tfrac{1}{2}\right)^5 = \tfrac{1}{32}P(HHHHH)=(21)5=321
The chance of five heads followed by a tail is 1/64, which is exactly half of that. So if you've just watched five heads happen, the chance the next flip is a tail is
P(T∣HHHHH)=P(HHHHH, then T)P(HHHHH)=1/641/32=12P(\text{T} \mid \text{HHHHH}) = \frac{P(\text{HHHHH, then T})}{P(\text{HHHHH})} = \frac{1/64}{1/32} = \frac{1}{2}P(T∣HHHHH)=P(HHHHH)P(HHHHH, then T)=1/321/64=21
The streak is the rare part. Once it has happened it is just history, and the coin has no way of reading it. The same calculation works for any streak length: the rarity of the run (here 1/32) always cancels against the rarity of the run plus one more flip, and what's left is 1/2.
It still feels wrong, and that feeling has been studied for a long time. Tversky and Kahneman called the underlying habit a belief in "the law of small numbers": people expect even short sequences to look like the long-run average, so a run of heads feels like it has put the coin in debt [2]. It isn't only a classroom effect. Chen, Moskowitz and Shue found negatively autocorrelated decisions, unrelated to the merits of the cases, among asylum judges, loan officers and baseball umpires, and they read it as consistent with the gambler's fallacy [1].
A rule of thumb that is not a fallacy
There is one catch that matters for the experiment. All of the above assumes you know the coin is fair. If you don't, a streak is evidence.
The classic way to formalize "I know nothing about this coin" is Laplace's rule of succession: after h heads in n flips, estimate the chance of heads next as
p^=h+1n+2\hat{p} = \frac{h + 1}{n + 2}p^=n+2h+1
After five heads in five flips that is 6/7, about 86%. An observer who starts with no opinion about the coin should expect the streak to continue, because five heads in a row is what a heavily biased coin would produce. So a model that expects repeats after a streak isn't automatically committing a fallacy. It might just be reasoning about an unknown coin.
That's why I ran every test twice: once with the coin left undescribed, and once with the prompt saying outright that it is a fair coin and that flips are independent. In the second version the correct answer is 1/2 at every streak length, with no wiggle room.
What's been done, and the gap I'm poking at
I'm not the first to point language models at coin flips. Bigelow and colleagues studied in-context learning on random binary sequences and found gambler's-fallacy-like patterns, with more alternation than chance, in sequences generated by some GPT models [3]. Van Koevering and Kleinberg compared the coin flips LLMs produce with the sequences humans write [4]. Mondal and colleagues made the case that a model's stated answer and the probabilities it computes can disagree, which they call revealed beliefs versus stated answers [5].
As far as I could find, though, nobody had put those pieces together on the specific question here: given a genuinely random sequence, how does the model's probability for the next flip move as the streak grows, does telling it the coin is fair fix that, and does it match what the same model says when asked directly? That's what I measured.
How to read a model's belief about a coin
A language model doesn't output "heads" or "tails". It outputs a probability for every token in its vocabulary. If I end a prompt right after a run of flips written as H T T H H, the model's probabilities for the tokens H and T are its guess for the next flip. Renormalizing over just those two gives a number I can read directly: the model's probability of heads.
There's a convenient trick. A model reads a sequence left to right, so a single forward pass over a whole sequence produces a probability for the flip at every position, each one based only on the flips before it. I generate a random sequence with NumPy, feed it in once, and read off the model's belief before every single flip.
import numpy as np, torchdef p_heads_before_each_flip(model, tok, header, flips): # flips: array of 0/1, where 1 = heads base = tok(header)["input_ids"] id_H = tok(header + " H")["input_ids"][-1] id_T = tok(header + " T")["input_ids"][-1] ids = base + [id_H if f else id_T for f in flips] with torch.no_grad(): logits = model(torch.tensor([ids])).logits[0, len(base) - 1 : -1].float() return torch.sigmoid(logits[:, id_H] - logits[:, id_T]).numpy()
The sigmoid of the difference between the two logits is the probability of heads after renormalizing over H and T. The slice len(base) - 1 : -1 picks the positions that predict flips 0, 1, 2, and so on.
Then I group those probabilities by how long the streak was just before each flip, and turn them into "probability that the streak continues":
def streak_and_p_repeat(flips, p_heads, r_max=10): p_repeat = np.where(flips[:-1] == 1, p_heads[1:], 1 - p_heads[1:]) run = np.ones(len(flips), dtype=int) for j in range(1, len(flips)): run[j] = run[j - 1] + 1 if flips[j] == flips[j - 1] else 1 return np.minimum(run[:-1], r_max), p_repeat
Average p_repeat within each streak length across many sequences and you have a curve. Because the sequences are truly random, the true answer is 0.5 at every streak length. Anything else on that curve is the model's own prior leaking through, since there is nothing in a random sequence for it to have learned.
One sanity check matters here. If a model puts most of its probability on some other token, say a newline or the word "The", then the renormalized H versus T number is measuring a sliver of its attention. So I record how much total probability lands on H and T for every model and prompt.
I used four open model families, each as a base model and as the instruction-tuned version: Qwen2.5 (1.5B and 3B), SmolLM2-1.7B and OLMo-2-1B. Comparing base and instruct is deliberate. Instruction tuning is the stage where models are trained to be sensible and helpful, and I wanted to see whether it removes a bias, adds one, or does nothing.
For each model I generated 1,200 random sequences of 60 fair flips, shared across models so every model sees identical data. That gives 59 predictions per sequence, and the curves average them by streak length, with 95% confidence intervals from resampling whole sequences.
The first is the main one: the streak curves, under two prompt headers. The plain header says only "Here is a record of coin flips (H = heads, T = tails):". The fair-coin header says the coin is fair and each flip is independent of the ones before it.
The second compares saying with doing. To get what a model says, I asked a multiple-choice question: a fair coin (or an idealized roulette wheel) has just landed the same way k times in a row, for k from 3 to 12, and the model chooses among "less than 50%", "exactly 50%" and "more than 50%" for the chance of another repeat. I shuffled the order of the options, since models have letter preferences. To get what the instruct models do, I showed 24 random flips ending in a planted streak of a chosen length and asked for the next flip, in the model's chat format, then read the probabilities of H and T in the answer slot.
The third is a learnability check. I made two more kinds of data, one where each flip repeats the previous with probability 0.7 and one where it repeats with probability 0.3, so streaky and alternating coins. If a model's behavior on the fair coin is a stubborn prior, it should fail to adapt to these. If it's just a default that evidence can override, it should follow the data.
What the models expect after a streak
Figure 1 is the central result. The dashed line is the right answer for a fair coin. The dotted line, in the top row, is what an ideal learner with no opinion about the coin would expect, so it shows how far above 0.5 a streak could justify going if you didn't know the coin was fair.
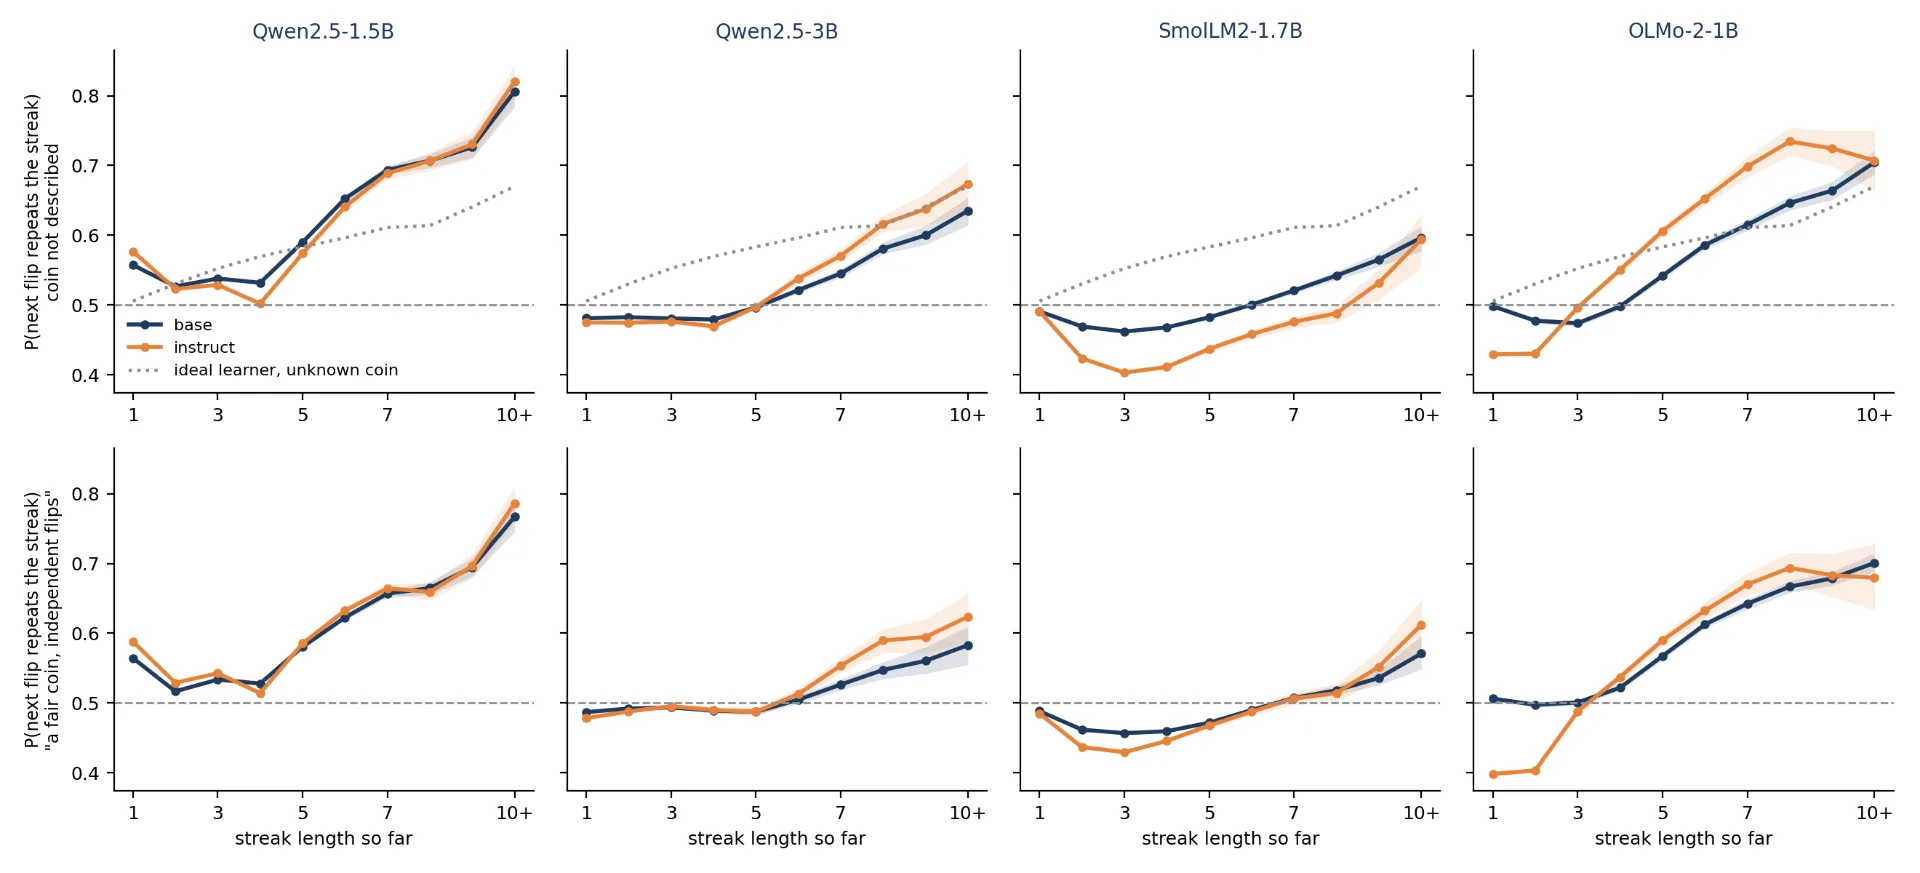
Probability that the next flip repeats the current streak, by streak length, on random fair-coin sequences. Navy = base model, orange = instruction-tuned; shaded bands are 95% intervals. Top row: coin not described. Bottom row: the prompt says the coin is fair. Image by author.
Most of these models do not fall for the gambler's fallacy. For long streaks they do roughly the opposite. In all eight models the probability of a repeat climbs once the streak passes about four flips, and after ten or more identical flips it is 0.81 (base) and 0.82 (instruct) for Qwen2.5-1.5B, 0.71 and 0.71 for OLMo-2-1B, 0.64 and 0.67 for Qwen2.5-3B, and 0.60 and 0.59 for SmolLM2-1.7B. The correct value is 0.50.
The short end of the curve is more mixed. For streaks of one to four flips, the Qwen models stay between 0.47 and 0.58. SmolLM2 and OLMo-2-Instruct dip below 0.5: SmolLM2-Instruct falls to 0.40 at a streak of three, and OLMo-2-Instruct sits at 0.43 at streaks of one and two. That is a small, gambler's-fallacy-style lean toward alternation, and it reverses as the streak grows.
Part of the upswing is defensible. On these same sequences, an observer who knows nothing about the coin (the dotted line) should expect about 0.60 at a streak of six and 0.67 at ten or more. Qwen2.5-3B and SmolLM2 stay at or below that line. Qwen2.5-1.5B overshoots it by about 14 points at ten or more. Instruction tuning changes little: the base and instruct curves nearly coincide for both Qwen models, and the biggest differences are in OLMo-2 and SmolLM2 at short streaks.
The second row is the stricter test. There the prompt says the coin is fair and the flips are independent, so the ideal learner's room to go above 0.5 is gone.
Saying the coin is fair helps only a little. At ten or more flips, Qwen2.5-1.5B goes from 0.81 to 0.77 (base) and from 0.82 to 0.79 (instruct), Qwen2.5-3B from 0.64 to 0.58 and from 0.67 to 0.62, and OLMo-2-1B barely moves (0.71 to 0.70 base, 0.71 to 0.68 instruct). SmolLM2-Instruct goes the wrong way, from 0.59 to 0.61. With 0.50 as the right answer, every model is still at least seven points above it at ten or more flips, and the curves keep their shape.
One more number: the models are lopsided before they have seen a single flip. The probability of heads on the first flip ranges from 0.59 to 0.99 across the eight models and two prompts. My header lists heads first, which may be part of the reason, but I didn't test the header order.
What they say versus what they do
Figure 2 puts the two measurements side by side. On the left, each model's answer to the direct question, averaged over the coin and roulette versions and over the streak lengths. On the right, the probability the chat version assigns to the streak continuing when it has to predict the next flip.
Left: how each model's probability is split across the three answers when asked directly (averaged over the coin and roulette questions and streak lengths 3 to 12). Right: the instruct models' probability that a streak of the given length continues when they are asked to predict the next flip. Image by author.
What the models say is inconsistent. Qwen2.5-3B-Instruct is nearly perfect: 88% on "exactly 50%" overall and 100% on every coin question, though it slips on roulette, where it puts 7% to 33% on "less than 50%". Qwen2.5-1.5B-Instruct is the opposite: 52% on "less than 50%", the gambler's answer, and only 13% on the right one. OLMo-2-1B-Instruct spreads its probability almost evenly (32%, 36%, 32%), so it isn't really answering the question. The base models and SmolLM2-Instruct put only 18% to 53% of their probability on the three answer letters, so I'd treat their answers as weak evidence.
What the instruct models do is a different story. After a planted streak of twelve, Qwen2.5-1.5B-Instruct expects it to continue 69% of the time, SmolLM2-Instruct 63%, Qwen2.5-3B-Instruct 56% (interval 0.49 to 0.63) and OLMo-2-Instruct 50%. Compared with the plain-text version in Figure 1, the chat format softens the effect for three of the four, but it doesn't remove it for Qwen2.5-1.5B or SmolLM2.
The sharpest mismatch is Qwen2.5-1.5B-Instruct. Asked in words, it leans toward "less than 50%", the gambler's answer. Asked to predict, it leans toward the streak continuing. Its answers and its probabilities point in opposite directions.
Can they learn a streaky coin?
Figure 3 averages the model's expected repeat rate over every position and plots it against how often the data really repeats. A model that tracks the data would follow the diagonal.
How often the models expect the next flip to repeat (averaged over all positions) against how often the data really repeats it. Lines are the average of the four models of each kind; bands span the lowest and highest model. Image by author.
All eight models move in the right direction, and none moves far enough. Between a coin that repeats 30% of the time and one that repeats 70% of the time, the true repeat rate rises by 0.40. The models' expected repeat rate rises by 0.09 (SmolLM2-1.7B) to 0.22 (OLMo-2-1B-Instruct). So they do pick up on the data, at between a fifth and a little over half of the right volume. On the fair coin, the eight models' averages range from 0.46 to 0.56.
Position in the sequence matters too. In the first ten flips, all eight models lean toward alternation: the average probability of a repeat is between 0.37 and 0.47, below 0.5 every time, which echoes the alternation Bigelow and colleagues found in generated sequences [3]. From flip 11 it recovers, and for Qwen2.5-1.5B it overshoots (0.57 to 0.59 for flips 21 to 59). As a sanity check, the probability on the two answer tokens, H and T, is between 0.85 and 0.96 in every setting, so these curves are not an artifact of a model wanting to say something else.
These are small open models, up to about three billion parameters. The method needs exact next-token probabilities, which most hosted frontier models don't expose, so I can't say what the largest chat models do internally. Everything here is coin flips written as single letters; a model might behave differently on a story about a basketball player or a roulette table. The probabilities depend on prompt wording, which is why I used two headers and shuffled the answer options instead of trusting one phrasing. The multiple-choice results are shaky for several models, because the base models and SmolLM2-Instruct put much of their probability on tokens other than the three letters. And the explanation I offer below for the long-streak effect is a guess I didn't test.
Do LLMs fall for the gambler's fallacy? Mostly not, and for long streaks they do the reverse. The early part of a sequence shows a small pull toward alternation, but as streaks grow, the expectation of a repeat climbs in all eight models, and at ten or more flips it is 0.60 to 0.82 where 0.50 is right. Telling the model the coin is fair trims that by a few points at most. Instruction tuning changes little overall, and the models do pick up on a streaky or alternating coin, but at a fraction of the right strength.
I can only guess at the cause. Language models are pulled strongly toward continuing patterns that are already in their context, and a streak is the most repeatable pattern there is. That would make this a copying habit more than a belief about coins, but I didn't test it, so take it as a hypothesis.
The mismatch between words and probabilities matters more in practice. Qwen2.5-1.5B-Instruct leans toward the gambler's answer when asked and toward continuation when predicting. If you use a small model to forecast or simulate anything sequential, its probabilities may carry a prior about streaks that its written answers never mention.
[1] Chen, Moskowitz, Shue, Decision-Making Under the Gambler's Fallacy: Evidence from Asylum Judges, Loan Officers, and Baseball Umpires (2016), The Quarterly Journal of Economics 131(3), 1181–1242
[2] Tversky, Kahneman, Belief in the Law of Small Numbers (1971), Psychological Bulletin 76(2), 105–110
[3] Bigelow, Lubana, Dick, Tanaka, Ullman, In-Context Learning Dynamics with Random Binary Sequences (2023), arXiv:2310.17639
[4] Van Koevering, Kleinberg, How Random is Random? Evaluating the Randomness and Humaness of LLMs' Coin Flips (2024), arXiv:2406.00092
[5] Mondal, Dolamic, Bovet, Cudré-Mauroux, Audiffren, Do Large Language Models Exhibit Cognitive Dissonance? Studying the Difference Between Revealed Beliefs and Stated Answers (2024), arXiv:2406.14986
Make your workflow easier, faster, and less time-consuming.
April 25, 20216 min read
Building automated clinical coding systems with LLMs
May 16, 202417 min read
How scikit-learn's cross_val_score makes this critical process easy
July 31, 20226 min read
What I think about the progress and shortcomings after practice
December 17, 202415 min read
I am doing a video analysis A.I. project for a client, and I want to share with you a super fun idea that popped into my mind tonight while...
Build a working model with 6 lines of code
March 23, 20236 min read
From Data to Product Recommendations
July 31, 202417 min read
A practical walkthrough of time-series foundation models: how they forecast with patches and quantiles, where t0-alpha fits on GIFT-Eval, and what its reproducible result says about the field.
July 2, 202619 min read
A comparative analysis of the roles and responsibilities, points of overlap and expectations of the 'sexiest job of the 21st century'.
March 19, 20218 min read
原文为英文,正文由自动抓取并保留原文。
原文发布于 Towards Data Science(After 10 Heads in a Row, Small LLMs Bet Up to 82% on an 11th),标题、摘要与正文由机器翻译,术语按行业惯例统一,未经人工逐句校订。