datasette-maplibre 0.1a0 发布
我用一条发给 Claude Fable 5.2 的提示词完成了其中大部分工作:
看看 datasette-cluster-map 和 datasette-leaflet-geojson 这两个插件,再看看 ~/dev/tools/openfreemap-demo.html,然后构建一个全新的 Datasette 插件,使用 maplibreGL 和 openfreemap,并把另外那两个插件的功能结合起来——但要发挥创意、跳出框框,想想这个插件还能有哪些其他有用的功能
“发挥创意、跳出框框”带来了几个不错的主意——我最喜欢的是它会先显示 GeoJSON 图形的 SVG 预览,只有当它们滚动进入视野时才加载 WebGL 预览。
我还让 Claude 构建了一个全面的演示,它能在最新的 Datasette Lite 中运行,所以你可以访问这个链接,通过 Pyodide 和 WebAssembly 在浏览器中加载该插件和一个演示数据库。
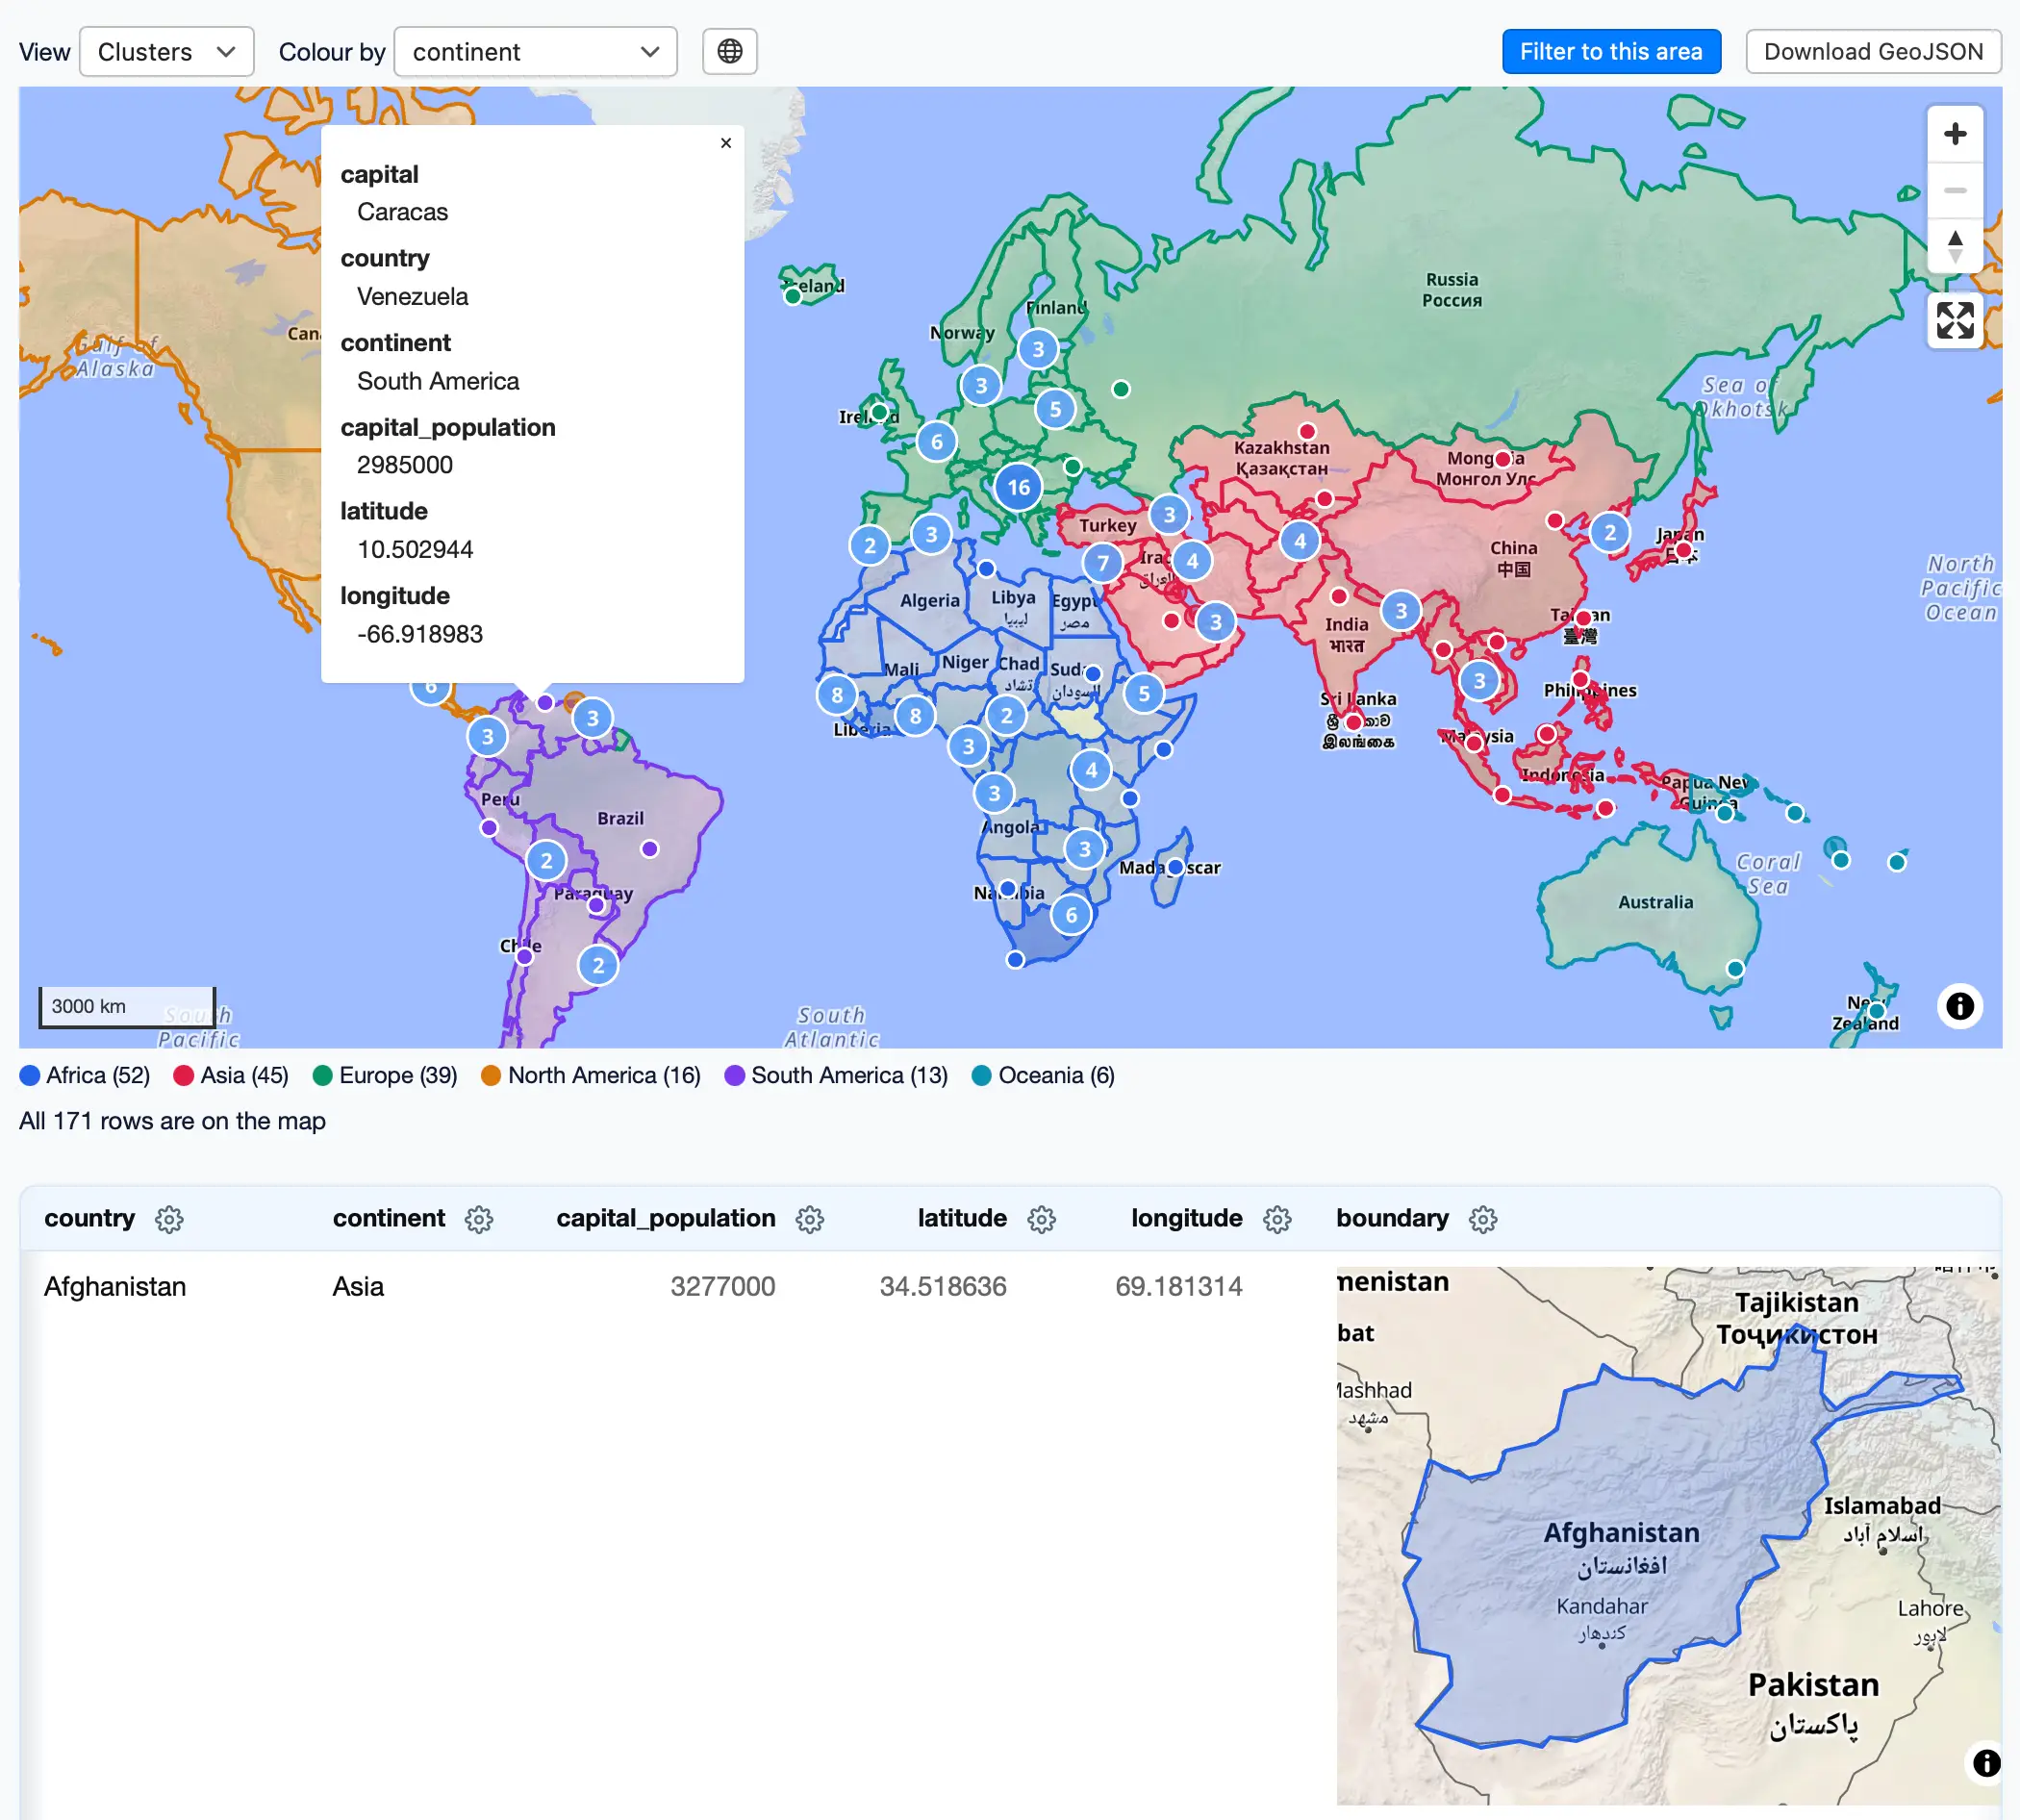
我喜欢这个演示页面,它在同一张地图上同时显示 GeoJSON 图形和经纬度点:
发布于 2026 年 11 月 15 日晚上 11:58
这是 Simon Willison 发布的一篇内容,发布时间为 2026 年 11 月 15 日。
每月赞助我 10 美元,即可获得一份精选邮件摘要,内容涵盖当月最重要的 LLM 进展。
付钱让我少发给你!
译文由英文原文机器翻译,术语按行业惯例统一,可在文末展开原文核对。
查看英文原文(datasette-maplibre 0.1a0)
I built most of this with a single prompt to Claude Fable 5.2:
Look at datasette-cluster-map and datasette-leaflet-geojson plugins, then look at ~/dev/tools/openfreemap-demo.html - then build a brand new Datasette plugin that uses maplibreGL and openfreemap and combines the features of those other two plugins - but be creative and think outside the box for other useful features the plugin might have
"Be creative and think outside the box" resulted in a few neat ideas - my favorite is that it displays SVG previews of GeoJSON shapes, then loads a WebGL preview only when they scroll into view.
I also had Claude build a comprehensive demo which works in the latest Datasette Lite, so you can visit this link to load the plugin and a demo database in your browser via Pyodide and WebAssembly.
I like this demo page showing both GeoJSON shapes and lat/lon points on the same map:
Posted 15th November 2026 at 11:58 pm
This is a beat by Simon Willison, posted on 15th November 2026.
Sponsor me for $10/month and get a curated email digest of the month's most important LLM developments.
Pay me to send you less!
原文为英文,正文由自动抓取并保留原文。
原文发布于 Simon Willison(datasette-maplibre 0.1a0),标题、摘要与正文由机器翻译,术语按行业惯例统一,未经人工逐句校订。