百余个 AI 智能体数据:失败源于静默漂移而非报错

如何在错误触发之前监控生产环境中的 AI 智能体
我们习惯了那种往往会“大声”报错的传统软件。服务抛出异常,或者请求返回 500。我们能明显看到错误率攀升。但 AI 智能体通常不是这样运作的。
智能体可以持续返回自信、格式规范的答案,同时准确率却越来越低、成本越来越高、速度越来越慢。遗憾的是,这些问题都不会以明显的错误形式暴露出来,这也让它对生产环境的破坏性可能更大。
我们想看看这在实践中究竟如何表现,于是我所在的团队分析了数十家公司 100 多个生产环境 AI 智能体在七个月内的告警数据。我们观察到了一种一致的模式:
问题在监控启动后的数天内就会浮现。
质量、成本和速度问题最先出现。错误是最后才触发的,也是最不可能触发的。
大多数问题会反复出现。尤其是失控循环,往往会演变成慢性问题。
问题会成群出现:Token 激增几乎总是伴随其他预警信号,最常见的是输出质量下降。
团队现有的检查措施严重偏向输出质量和成本,几乎不涉及治理与安全。
本文逐一梳理每一项发现,以及它们对团队应如何在生产环境中监控智能体意味着什么。
数据来自 Monte Carlo,也就是我联合创办的公司,这些智能体正是在那里接受监控。它覆盖了数十家客户公司中 100 多个生产环境 AI 智能体,这些智能体运行在 Snowflake Cortex、Databricks Genie 上,或是自定义构建、将 OpenTelemetry 风格的追踪数据发送到公司自有数据仓库。在本次分析中,我们查看了 2026 年 4 月 9 日至 11 月 2 日期间针对这些智能体触发的告警。
每个智能体都配置了若干检查项的组合,我们将这些检查项归为以下几类:
输出质量评估,由 LLM 评审对回答进行打分,评估有用性、有据性或任务完成度等方面。
对智能体运行过程的 Token 消耗、延迟和错误检查,采用异常检测或固定阈值的方式。
失控循环检查,用于标记智能体重复执行同一工具调用、查询或重试,远超正常单次运行所需次数的情况。
对智能体所采取步骤序列的轨迹与验证检查。
“警报”意味着其中某一项检查被触发。它代表阈值被突破或出现异常,而非已确认的故障。我们排除了内部、演示、测试和试用工作区,测试监测器,生产智能体的开发副本,以及被暂停且从未触发过的监测器。同一账户中配置完全相同的智能体只计一次。文末列出的局限性决定了这些数字应当被推到多远。
以下是我们发现的关键洞察。
问题在数天内就会浮现
在我们考察的数据中,89% 的被监测智能体在分析期内至少触发过一次警报。其中一半是在首次检查上线后一周内触发的,而首次警报的中位时间仅为 6 天。
这与其说反映智能体的质量,不如说反映它们与真实世界的接触程度。智能体往往能通过测试,但进入生产环境的第一天就会遇到真实用户、真实数据和真实边缘情况。因此,检查几乎立刻开始触发。
质量与成本在错误浮现之前就已出问题
我们探究的一个更有启发性的问题是:究竟哪些检查会触发,以及何时触发。对于每一类检查,我们只看配备了该检查的智能体,然后衡量其中有多少曾触发过警报,以及首次警报耗时多久。
图 1:配备各类检查的智能体中曾触发过警报的比例,以及首次警报的中位天数。图片由作者提供。数据来源:109 个生产 AI 智能体的聚合遥测数据。
用于监测智能体工作质量与效率的监控项触发得又早又频繁。在具备输出质量评估的智能体中,83% 触发了质量告警,首次触发的中位时间为 8 天。Token 消耗与延迟检查的情况类似:约四分之三的智能体触发了告警,通常发生在 8 到 9 天内。循环检查(在存在此类检查的情况下)几乎立即触发,中位时间为 1 天。
如图 1 所示,错误检查是个例外。在具备错误检查的智能体中,不到一半曾触发过错误告警,而触发者的中位耗时为 42 天——约六周。
当我们查看每个智能体最先到达的是哪种告警时,只有约 1% 的智能体将错误列入首批告警之中。质量告警和 Token 告警则各自在 38% 的智能体中位列最先触发的信号。
这正是“漂移”论点的核心。当智能体产出能被错误检查识别的东西时,它通常已经连续数周给出更差的答案、消耗更多 Token,或运行得更慢。以错误率为起点的监控方案,盯的是最后才发生变化的东西,因而错过了那些早已在悄悄积累的负面后果。
大多数问题会反复出现
第二种模式是持续存在。对于触发告警的智能体,我们统计了每类检查分别在多少个不同的日期触发。
图 2:按每类检查触发的不同日期天数衡量的智能体问题持续性。图片由作者提供。数据来源:109 个生产环境 AI 智能体的聚合遥测数据。
对每一种检查类型而言,大多数触发告警的智能体都是在三个或更多不同的日期上告警。一次性告警只占少数:质量评估为 16%,Token 支出为 20%,延迟和错误约为三分之一。失控循环最为持续:出现循环告警的智能体中,78% 在三个或更多日期都出现循环告警,中位数为九个不同日期。
这里有一个注意事项,我们在局限性部分已有说明:某些检查会因同一持续存在的状况而重复告警。我们统计的是不同日期而非告警次数,以减轻这一影响,但其中一些看似慢性的问题,实际上可能只是一个长期未解决的问题。无论如何,实际意义是一样的:大多数智能体问题无法靠一次性补丁解决,而把每次告警都当作孤立事件处理,会掩盖这一现实。
成本、质量与速度同向变化
如果智能体是逐渐漂移而非突然崩溃,那么这些信号理应同向变化。Token 支出是检验这一理论的好切入点,而根据我们的分析,该理论成立。
在配置了 Token 检查的智能体中,约四分之三至少触发过一次 Token 异常,而几乎所有这些异常都是增长:下降的不足 3%。
为了了解 Token 用量激增时还发生了什么,我们取每个智能体出现 Token 激增的日期,并查找附近的其它告警:同一智能体在截至激增当天(含当天)的两天内出现的告警,或同一公司的另一个智能体在一天内出现的告警。随后,我们将这些情况与同一智能体的其它所有日期进行对比。
图 3:Token 激增前后伴随警示信号出现的频率与普通运行日的对比。图片由作者提供。数据来源:109 个生产环境 AI 智能体的汇总遥测数据。
在 92% 的激增日里,附近至少还出现了另一个预警信号,而普通日子这一比例只有 48%。最常见的伴随信号是质量或行为告警,比如评估分数下降,或某个工具被错误调用——这类告警出现在约 58% 的激增日,而其他日子仅为 19%。延迟和错误告警的关联最强,在激增日前后出现的可能性是其他日子的 3.4 倍,循环告警则是 2.8 倍。有三分之一的情况是,同一家公司的其他智能体同时出现激增,这说明背后有共同诱因,比如流量激增或模型变更。
这些都不能证明某一次激增的成因。但它符合漂移模式:当某个智能体开始表现得不一样时,成本、质量和速度往往同时变化,而只监控其中一项的检查只能看到变化的一小部分。
循环藏在工具调用里,而少有团队会看那里
失控循环值得单独用一节来讲,因为它既普遍又缺乏监控。看到循环告警的公司数量,与看到错误率告警的公司数量大致相当。而在 72% 的循环告警中,涉及工具调用和 SQL 调用:智能体反复重跑同一条查询、重试失败的工具,或反复重新规划同一步骤。
然而,大多数团队现有的计时检查其实并不会看那里。在设有任何延迟或时限检查的智能体中,84% 只对端到端运行计时,仅 18% 对单个工具调用计时。每五个针对循环进行监控的智能体中,就有四个其工具调用完全没有计时检查。当循环拖慢一次运行时,团队能看到这次运行耗时更长,却看不出是哪个具体工具卡住了。
Token 支出也存在同样的盲区。在样本的 Token 检查中,62% 监控的是整个运行、追踪或对话,另有 24% 监控的是按天或按小时的合计。只有 8% 与特定的工具、步骤或跨度(span)绑定。这就使得近九成带有 Token 检查的智能体只能显示支出上升了,却无法指明是哪个步骤消耗了 Token。
团队所监控内容中的治理缺口
纵观样本中的所有智能体,图 4 展示了至少具备每类检查其中一项的智能体占比。
原文较长,译文为节选;译文由英文原文机器翻译,术语按行业惯例统一,可在文末展开原文核对。
查看英文原文(Data From 100+ AI Agents Shows They Fail by Silent Drift, Not Errors)
How to Monitor AI Agents in Production Before Errors Fire
We are used to traditional software that tends to fail loudly. A service throws an exception, or a request returns a 500. We see error rates climbing visibly. AI agents, however, don't typically work that way.
An agent can keep returning confident, well-formed answers while it gets less and less accurate, more expensive, or slower. Unfortunately, none of that shows up as an obvious error, which can make it all the more damaging to production environments.
We wanted to see how that plays out in practice, so my team analyzed alerting data from more than 100 production AI agents across dozens of companies over seven months. We observed a consistent pattern:
Problems surface within days of monitoring starting.
Quality, cost, and speed problems show up first. Errors are the last thing to fire, and the least likely to fire at all.
Most problems come back. Runaway loops, in particular, tend to become chronic.
Problems arrive together: token spikes almost always come with other warning signs, most often a drop in output quality.
The checks teams have in place lean heavily toward output quality and cost, and barely touch governance and safety.
This article walks through each finding and what it means for how teams should monitor agents in production.
The data comes from Monte Carlo, the company I co-founded, where these agents are monitored. It covers more than 100 production AI agents across dozens of customer companies, which run on Snowflake Cortex, Databricks Genie, or are custom builds that send OpenTelemetry-style traces to the company's own warehouse. For this analysis, we looked at alerts on the agents raised between April 9 and November 2, 2026.
Each agent had some combination of checks on it, which we grouped into types:
Output quality evaluations, where an LLM judge scores answers for things like helpfulness, groundedness or task completion.
Token spend, latency and error checks on the agent's runs, either as anomaly detection or fixed thresholds.
Runaway loop checks, which flag an agent repeating the same tool call, query or retry far more than a normal run needs.
Trajectory and validation checks on the sequence of steps the agent takes.
An "alert" means one of those checks fired. It is a threshold breach or anomaly, not a confirmed failure. We excluded internal, demo, test and trial workspaces, test monitors, development copies of production agents, and monitors that were paused and never fired. Agents with an identical setup in the same account were counted once. The limitations at the end matter for how far these numbers should be pushed.
Here are the key insights we found.
Problems surface within days
Across the data we looked at, we found that 89% of monitored agents raised at least one alert during the analysis period. Half did so within a week of their first check going live, and the median time to the first alert was just six days.
That says less about agent quality than about exposure to the real world. Agents often pass testing, but then they meet real users, real data and real edge cases on their first day in production. As a result, checks start firing almost immediately.
Quality and cost go wrong before errors surface
The more revealing question we interrogated is which checks actually fire, and when. For each type of check, we looked only at agents that had that check, then measured how many ever alerted and how long the first alert took.
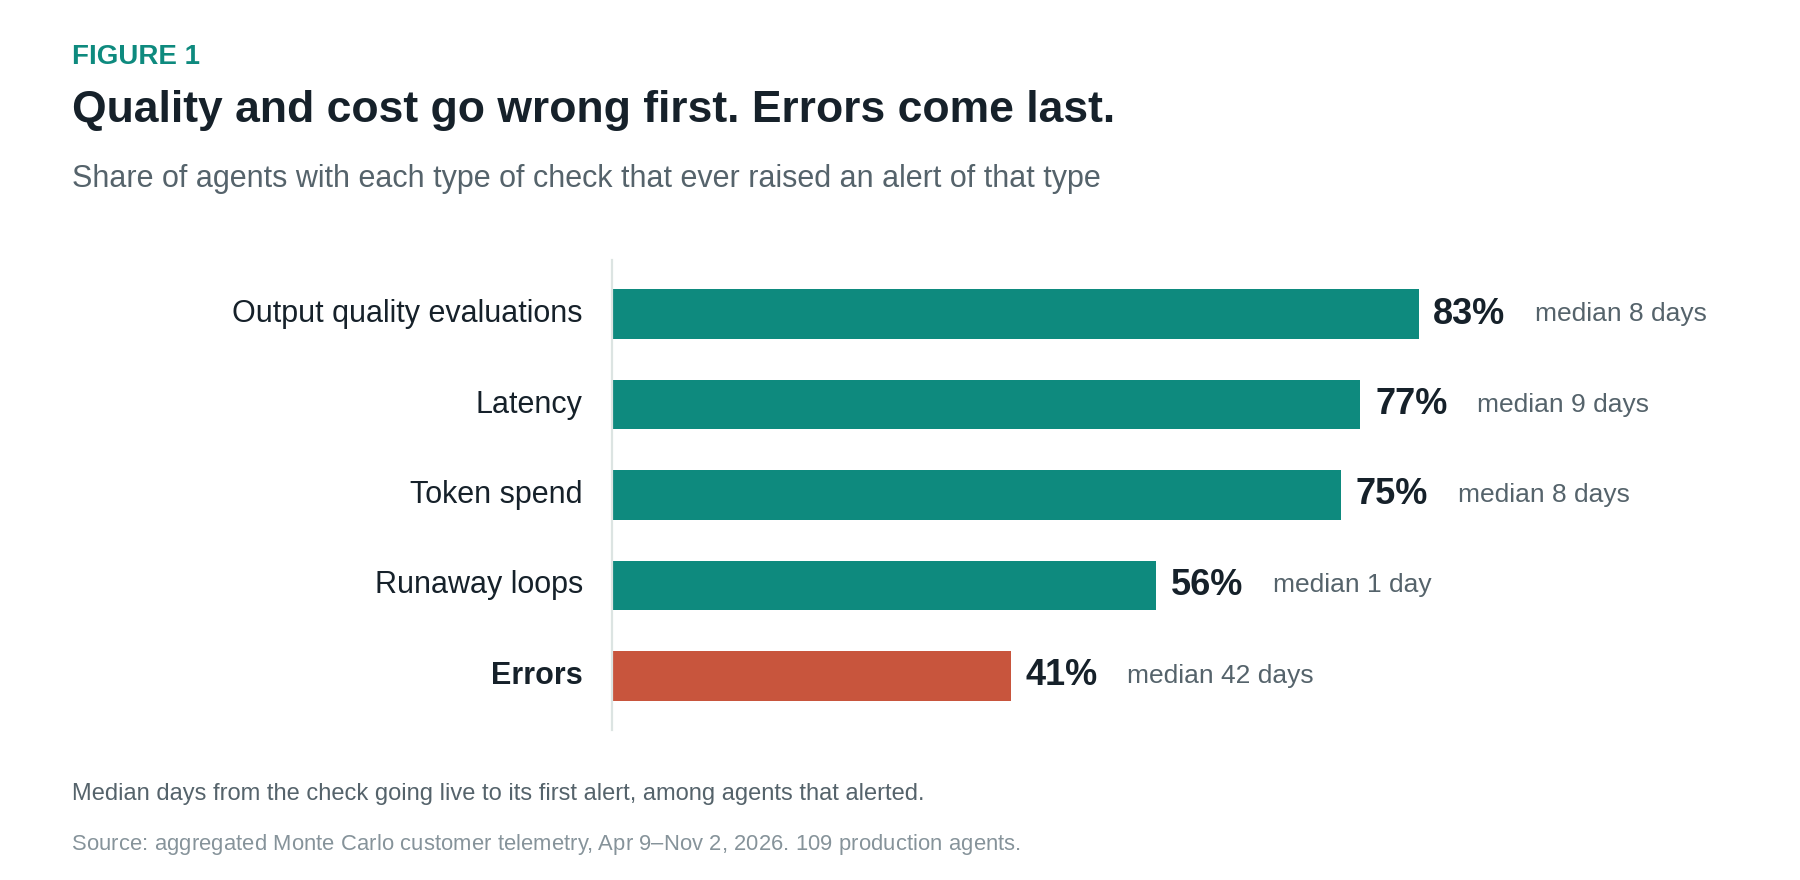
Figure 1: Share of agents with each check type that ever raised an alert, and median days to the first alert. Image by author. Data source: Aggregated telemetry across 109 production AI agents.
The monitors that watch how well and how efficiently an agent works fired early and often. 83% of agents with output quality evaluations raised a quality alert, with a median of eight days to the first one. Token spend and latency checks looked similar: about three-quarters of agents alerted, typically within eight or nine days. Loop checks, where they existed, fired almost immediately, with a median of one day.
As figure 1 shows, error checks were the outlier. Fewer than half the agents with error checks ever raised an error alert, and those that did took a median of 42 days – about six weeks.
When we looked at which alert arrived first for each agent, an error was among the first alerts for only about 1% of agents. Quality and token alerts were each among the first signals fired for 38%.
This is the core of the "drift" argument. By the time an agent produces something that an error check recognizes, it has usually already been giving worse answers, burning away more tokens, or running slower for weeks. A monitoring setup that starts with error rates is watching the last thing to change, and is missing the negative consequences that have been quietly piling up already.
Most problems keep coming back
The second pattern is persistence. For agents that alerted, we counted how many separate days each type of check fired.
Figure 2: Persistence of agent issues by the number of separate days each check type fired. Image by author. Data source: Aggregated telemetry across 109 production AI agents.
For every check type, most agents that alerted did so on three or more separate days. One-off alerts were the minority: 16% for quality evaluations, 20% for token spend and roughly a third for latency and errors. Runaway loops were the most persistent: 78% of agents with a loop alert had loop alerts on three or more days, with a median of nine separate days.
There is a caveat here, covered in the limitations: some checks can re-alert on the same ongoing condition. We counted separate days rather than alerts to reduce that effect, but some of what looks chronic will be one long-running problem. Either way, the practical point is the same: most agent problems are not fixed by a one-time patch, and treating each alert as an isolated incident hides that reality.
Cost, quality, and speed move together
If agents drift rather than break, it follows that the signals should move together. Token spend is a good place to test that theory, and it holds based on our analysis.
About three-quarters of agents with a token check raised at least one token anomaly, and almost all of those anomalies were increases: fewer than 3% were drops.
To see what else was happening when token use spiked, we took each day an agent had a token spike and looked for other alerts nearby: on the same agent within the two days up to and including the spike, or on another agent at the same company within a day. We then compared that with every other day for the same agents.
Figure 3: Frequency of companion warning signs appearing around a token spike compared with ordinary operating days. Image by author. Data source: Aggregated telemetry across 109 production AI agents.
On 92% of spike days, at least one other warning sign showed up nearby, compared with 48% of ordinary days. The most common companion was a quality or behavior alert, like an evaluation score dropping or a tool being called out of order, which appeared around 58% of spikes versus 19% of other days. Latency and error alerts had the strongest link, at 3.4 times as likely around a spike as on other days, and loop alerts were 2.8 times as likely. In a third of cases, other agents at the same company spiked at the same time, which points to a shared cause such as a traffic surge or a model change.
None of this proves what caused any single spike. But it fits the drift pattern: when an agent starts behaving differently, cost, quality and speed tend to move at once, and a check that watches only one of them sees a fraction of the change.
Loops live in tool calls, where few teams look
Runaway loops deserve their own section, because they are both common and under-instrumented. About as many companies saw loop alerts as saw error-rate alerts. And 72% of loop alerts involved tool and SQL calls: an agent re-running the same query, retrying a failing tool or re-planning the same step.
Yet the timing checks most teams have in place don't actually look there. Of agents with any latency or time-limit check, 84% time the end-to-end run and only 18% time individual tool calls. Four in five agents monitored for loops have no timing check on their tool calls at all. When a loop slows a run down, the team can see that the run took longer, but not which individual tool got stuck.
Token spend has the same blind spot. Of the token checks in the sample, 62% watch a whole run, trace or conversation, and another 24% watch daily or hourly totals. Only 8% are tied to a specific tool, step or span. That leaves nearly nine in ten agents with a token check able to show that spend went up, but not which step burned the tokens.
The governance gap in what teams are watching
Looking across all the agents in the sample, Figure 4 illustrates the share with at least one check of each type.
Figure 4: Breakdown of monitoring coverage showing the share of agents with at least one check of each type. Image by author. Data source: Aggregated telemetry across 109 production AI agents.
Output quality evaluations are the most common, followed by token spend, latency and errors. Trajectory checks and validation rules are less common, and governance and safety checks (prompt injection, PII leakage, out-of-scope requests, policy violations) are the thinnest layer, at fewer than one in ten agents.
Two caveats apply: these categories come from monitor names, so a governance check with a generic name will be missed and the figures are floors. And a large share of these checks were set up with help from the monitoring vendor, so coverage partly reflects product defaults rather than only what teams chose. Even allowing for both, the gap between quality monitoring and governance monitoring is large.
Teams are using AI to monitor AI
One more pattern stood out. Among the monitors that customers built themselves, 57% were written by describing what they wanted to an AI in a chat interface rather than configured by hand. Teams are already using AI to decide what to watch in their AI. That makes it easy to add checks quickly, and it also makes it worth reviewing what those checks actually measure, given how much of the risk sits in steps and categories that are easy to overlook.
When teams ask an LLM to generate checks, the LLM naturally defaults to asking for output quality, accuracy, and tone. It rarely suggests looking for tool-call latency loops, data-freshness traps, or prompt injection without explicit prompting. AI makes it easy to spin up monitoring, but it tends to replicate our own blind spots.
What this means if you run agents
Insights like these have a few implications for teams running and monitoring production agents.
Don't rely on error rates, asthey are the last signal to move. Put output quality evaluations, token spend, and latency monitors in place first, because those are what show early markers when an agent starts to drift.
Don't treat each alert as a separate ticket. Agent problems tend to occur – and recur – together. Seeing all of an agent’s alerts together over a few weeks, including cost, quality, speed, and loops, shows patterns that a feed of one-off alerts hides.
Watch the tool calls. Loops are common, persistent, and are concentrated in tool and SQL calls. Time individual tool calls, count repeated calls within a run, and tag token counts with the step they belong to, rather than relying only on run-level totals to give you a sense of performance.
Work on closing the governance gap. Safety and policy checks don't typically appear by default. Decide which risks matter for each agent (PII, injection, scope) and add checks for them explicitly, otherwise you may have agents accessing and sharing things they shouldn't.
Check whether the aforementioned patterns hold for you. Look back at a few months of your own alerts and ask two questions: which type of check tends to fire first on a new agent, and how often the same agent trips the same check again. If error checks fire first and quality checks rarely fire at all, either your agents are unusually stable or your quality checks are too loose to catch drift.
Correlation and exposure, not cause. These are alerting patterns, not audits of agent behavior. An alert is a threshold breach, not a confirmed failure.
Uneven coverage. Agents usually have several quality evaluations and only one error check, so quality checks have more chances to fire. That inflates the quality numbers somewhat, though it does not explain why most error checks never fired.
Who set up the checks. The data comes from customers of one monitoring platform, and the platform or its staff set up more than half of the monitors, automatically or during onboarding. Default thresholds, especially for error checks, may be set conservatively, which would make errors look quieter than they are.
Re-alerting. Some checks can raise a new alert each day for one ongoing condition. Counting separate days reduces, but does not remove, that effect on the recurrence figures.
Concentration and small groups. Latency and loop alerts lean on a small number of companies, and trajectory and validation checks covered too few agents to report on separately.
The clearest thing this data says about production agents is that they rarely fail the way traditional software does. Failure emerges as drift — deteriorating answer quality, increased latency, and slowly rising costs — rather than a screaming error. When alerts do come in, they might arrive days or weeks after the original issue developed, resulting in problems that fester and permeate through a system. They also tend to recur, so treating each alert as a one-off incident can hide what's really going on.
To be explicit about this data and its limitations, there are things that it can and can't show. For instance, it came from teams that had already chosen to monitor their agents with a commercial platform, likely skewing our sample in favor of organizations with large, complex deployments. Additionally, we are only able to see problems that the monitors were configured to catch. We can't know how much agent drift is happening that has not yet been noticed, nor can we distinguish between legitimate problems and thresholds that are perhaps too sensitive. That is a nuance of each unique case that is for an engineer familiar with the deployment to say. Also, many teams already catch more obvious errors using existing application monitoring tools, potentially influencing the quieter error readings in this data.
Even with those caveats, the patterns of silent drift are still important to act on, and doing so does not require a dedicated product.
Teams can get much of the way there with OpenTelemetry tracing, open-source evaluation frameworks, and queries against traces in their own warehouse. What's more, some of the most effective measures aren’t monitoring at all. These include things like putting hard caps on tool retries and steps per run, implementing per-run token budgets, building regression test sets based on real production traffic, and ensuring human review of sampled outputs. More checks aren’t automatically better, either; every alert demands an engineer's attention, and alert fatigue is a very real consequence of a noisy setup.
Prevention at design time, using tactics like the aforementioned ones, works well in combination with monitoring and detection in production. Whatever tooling you use, consider the quieter sources of failure that are likely impacting your agents – your systems and products will be much better for it.
Disclosure: I'm the co-founder and CEO of Monte Carlo. The data in this article is aggregated, anonymized telemetry from Monte Carlo customers.
Why most AI agent projects fail in production isn't a model problem — it's an evaluation problem. Here's the framework we use across 100+ enterprise deployments to catch failures before they ship.
May 13, 202616 min read
Built over 14 days, all locally run, no API keys, cloud services, or subscription fees.
September 4, 202527 min read
A walkthrough of how to integrate metadata changes in DataHub into Jira workflows using the DataHub Actions Framework
September 22, 20257 min read
How a decision-first model can catch risky tool calls before they turn into real-world actions
October 9, 202610 min read
On 200 ToolRet questions and up to 3,794 tools, BM25 ran about 40x faster than BGE-large on just a CPU, and full tool docs made it the best setup tested.
November 13, 202614 min read
Outliers Found: Now What? A Guide to Treatment Options
July 16, 202415 min read
Adversarial ML from scratch. Let's learn the basic of adversarial machine learning together!
December 29, 20218 min read
Add architectural guardrails around how agents read untrusted sources and use them in the workflow.
October 10, 20266 min read
Thoughts and Theory Exploiting an innovative approach for self-supervised learning of Vision Transformers It has...
原文为英文,正文由自动抓取并保留原文。
原文发布于 Towards Data Science(Data From 100+ AI Agents Shows They Fail by Silent Drift, Not Errors),标题、摘要与正文由机器翻译,术语按行业惯例统一,未经人工逐句校订。